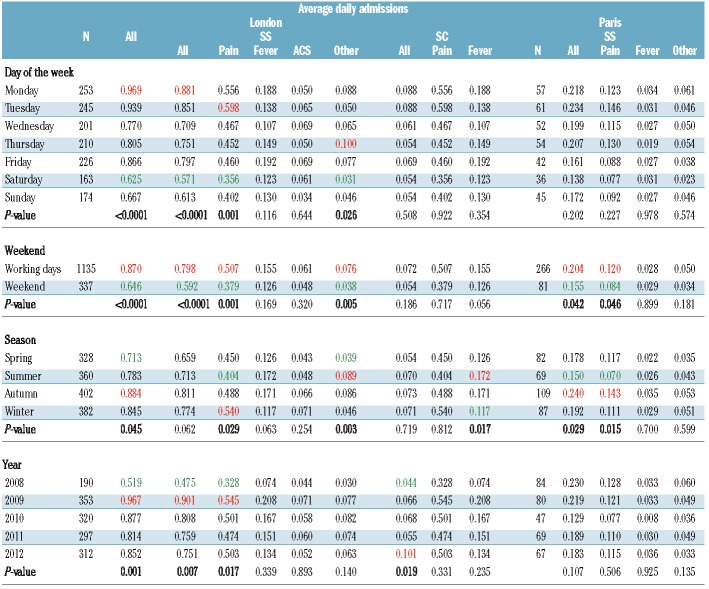
Table 3.
Effects of day of the week, weekend, season and year on admissions for sickle cell disease in Paris and London between 1st January, 2008 and 31st December, 2012, based on analyses of variance. Minimum and maximum values are highlighted in green and red, respectively, for columns in which a statistically significant difference was found (P<0.05).

