
Figure 2.
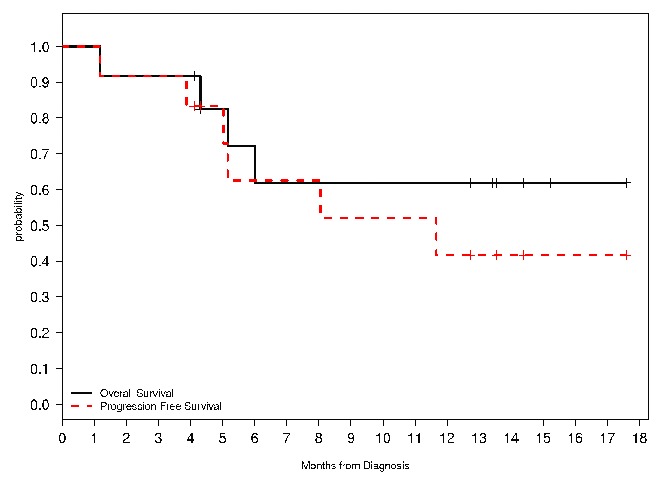
Overall (OS) and progression-free survival (PFS) estimates for those treated in cohort 3 and the expansion cohort. OS is noted in the solid black line, while PFS is the red dashed line.
Official websites use .gov
A
.gov website belongs to an official
government organization in the United States.
Secure .gov websites use HTTPS
A lock (
) or https:// means you've safely
connected to the .gov website. Share sensitive
information only on official, secure websites.
Overall (OS) and progression-free survival (PFS) estimates for those treated in cohort 3 and the expansion cohort. OS is noted in the solid black line, while PFS is the red dashed line.