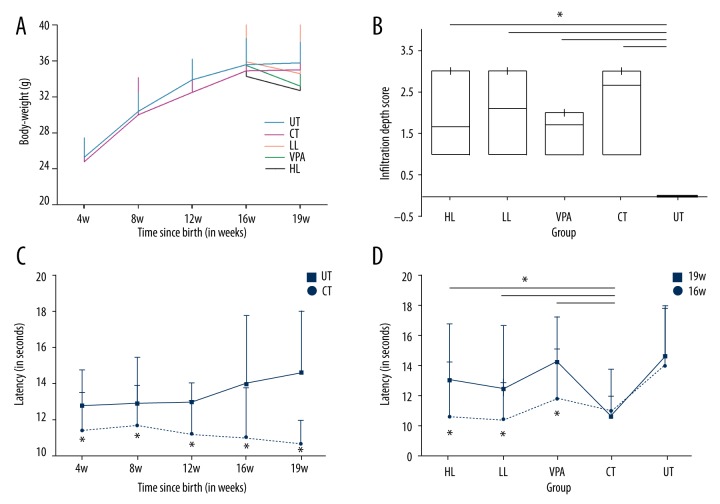
Figure 2.
(A) The average body weight of groups. (B) Assessment of the depth of myometrial infiltration in groups. (C) Hotplate latency in untreated group (control) and tamoxifen-treated group. (D) Hotplate latency of multiple groups. UT – untreated; CT – control; LL – low-dose leonurine; HL – high-dose leonurine.

