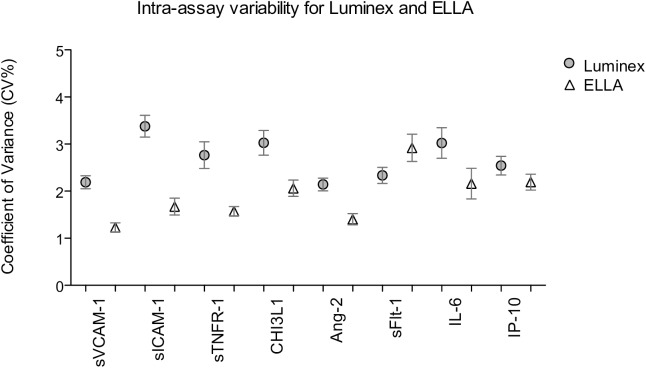
Fig 1. Intra-assay variability for biomarker concentrations determined using the Luminex® and EllaTM platforms.
Coefficient of variance (CV%) values for 156 sample assayed in duplicate by the Luminex® platform (shaded circles) and for 406–410 samples assayed by internal triplicate by the EllaTM platform (open triangles). Analysis for sICAM-1 was excluded due to inappropriate dilution range. Graphs depict point estimates of the mean CV% and the corresponding 95% confidence intervals.

