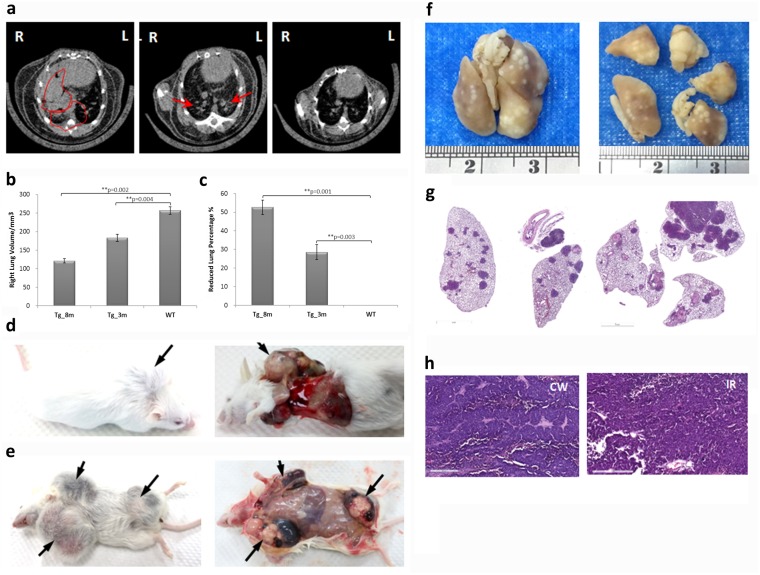
Fig 3. Tumor growths and metastasis of transgenic mice.
(a) Normal lung (wild-type; WT) and lung tumors at 3 (Tg-3m) and 8 months (Tg-8m) were evaluated using micro-CT. Arrows and circles indicate where solitary tumor nodules were observed. (b-c) Bar charts represent analytical results of the growing lung volume (mm3) and the reduced lung volume percentage compared to wild-type mouse (%). Statistical analysis between each stage of lung tumors and wild-type lung (Tg-8m v.s. WT and Tg-3m v.s. WT) was significant (P value <0.05) in t-test; group statistics of Tg-8m, Tg-3m, and WT lungs were also significant (P value <0.001) as verified using ANOVA (data not shown). The lung images shown of each age were representative of more than 3 animals that been scanned. (d-e) Macroscopic features of tumors in the chest wall and inguinal region. (f) Macroscopic and histological (g) image of formalin-fixed lung tumor multiplicity (100x magnification, H&E stained). (h) Histological examination of metastatic tumors in the chest wall (CW) and inguinal region (IR) (H&E stained). Histology of the metastatic nodules revealed typical ADCs features of rounded aggregates of tumor cells or acinar pattern with a glandular formation and cribriform arrangements. Scattered tumor cells within myofibroblastic stroma were also noted (400x magnification).

