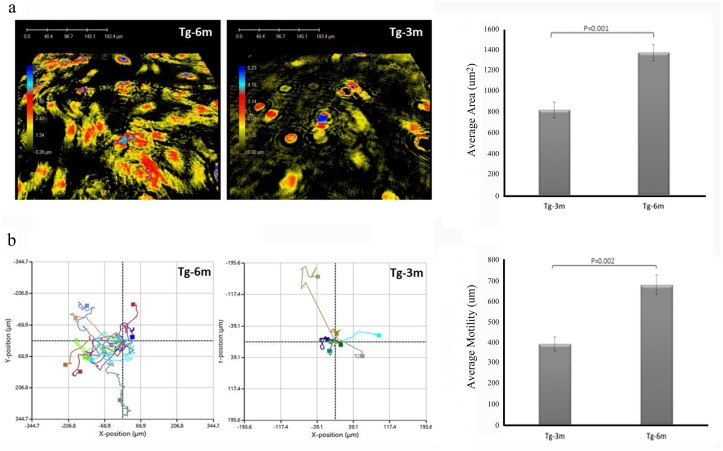
Fig 5. Holographic microscopy analysis of cellular movement.
Six-month (Tg-6m) cells were more versatile compared to Tg-3m cells in the captured image. Surface areas of Tg-3m and Tg-6m cells were measured and statistically plotted in a bar chart (μm2). (b) The paths of cell migration are presented as individual colored lines from Tg-3m and Tg-6m cells, and the average motility was calculated in the bar chart (μm). The Fig showed representative results of 3 independent experiments.

