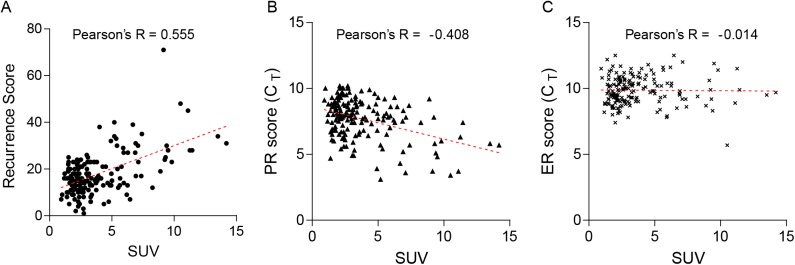
Fig 2. Scatter plots of continuous standardized uptake values (SUV) and continuous recurrence scores (RS).
(A) Continuous SUV and continuous RS (Pearson’s R = 0.555; P < 0.001); (B) Continuous SUV and continuous progesterone receptor expression (reverse transcriptase-polymerase chain reaction [RT-PCR]) (Pearson’s R = -0.408; P < 0.001); (C) Continuous SUV and continuous estrogen expression by RT-PCR (Pearson’s R = -0.014; P = 0.856). Footnote: CT, normalized expression cycle threshold levels.

