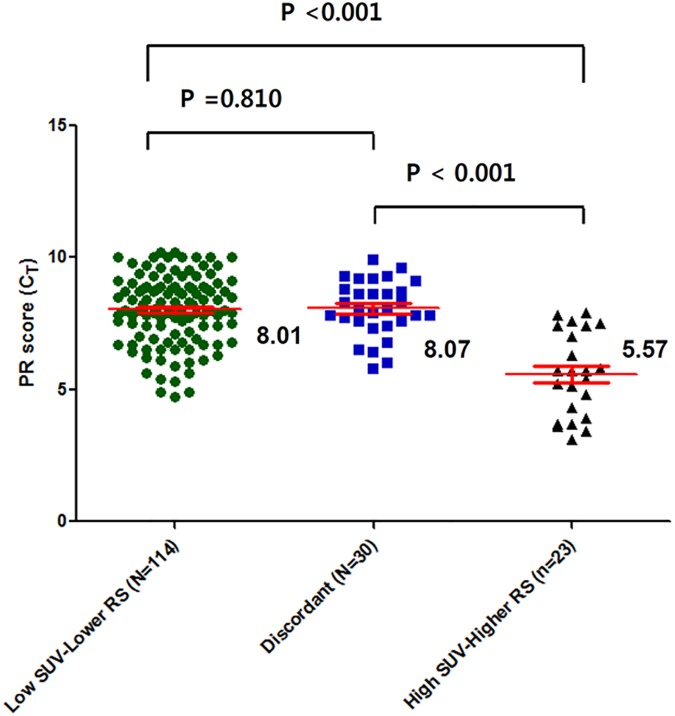
Fig 4. Average PR expression among the three groups, divided by dichotomized SUV and dichotomized RS groups (low SUV-lower RS, the discordant, and high SUV-higher RS).
The mean PR expression, determined using reverse transcriptase-polymerase chain reaction, of the high SUV-higher RS was significantly higher than that of the discordant group or the low SUV-lower RS group (P < 0.001 and P < 0.001, respectively; All P-values by the Student’s t-test). However, the mean PR scores (CT) did not differ between the low SUV-lower RS and the discordant groups (P = 0.810). Footnote: CT, normalized expression cycle threshold levels.

