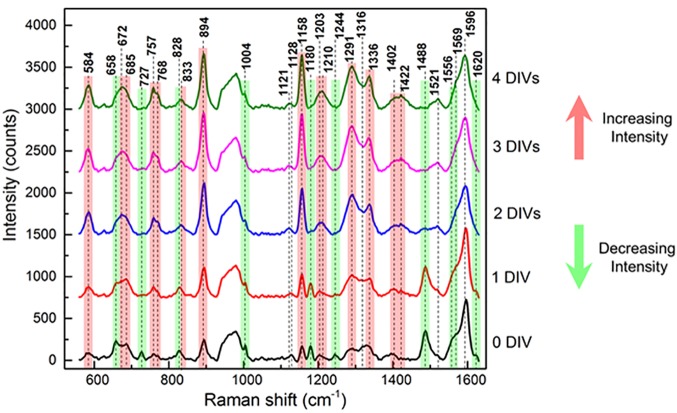
Fig 3. Raman spectra of the 3T3 conditioned medium collected from one to four DIVs.
Raman spectra of DMEM culture medium collected at different DIVs of mouse embryonic fibroblasts NIH/3T3 cell line. DIV0 corresponds to complete DMEM without conditioning with cell culture. The measurements were done with 532 nm laser line, 1 mW power and 10 second acquisition time in liquid conditions. The red and green lines indicate the peaks with increasing and decreasing intensities, respectively.

