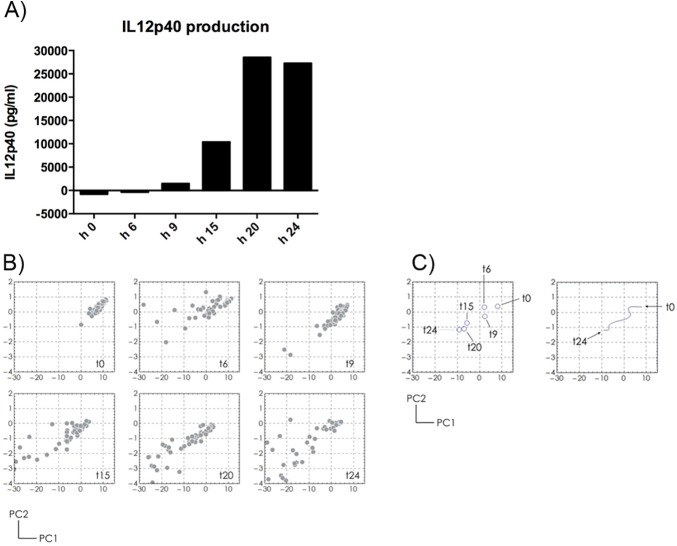
Fig 6. Analysis of the Raw 264.7 conditioned medium after LPS stimulation.
Raw 264.7 cells are stimulated with LPS for 24 hours. At 0, 6, 9, 15, 20, 24 hours, A) IL12p40 production was quantified by ELISA and B) Raman spectra of conditioned medium were collected. By PCA analysis, the spectra collected at each time point clusterize. C) The cluster centers for each time point are reported (left panel) as well as the trajectory described (right panel).

