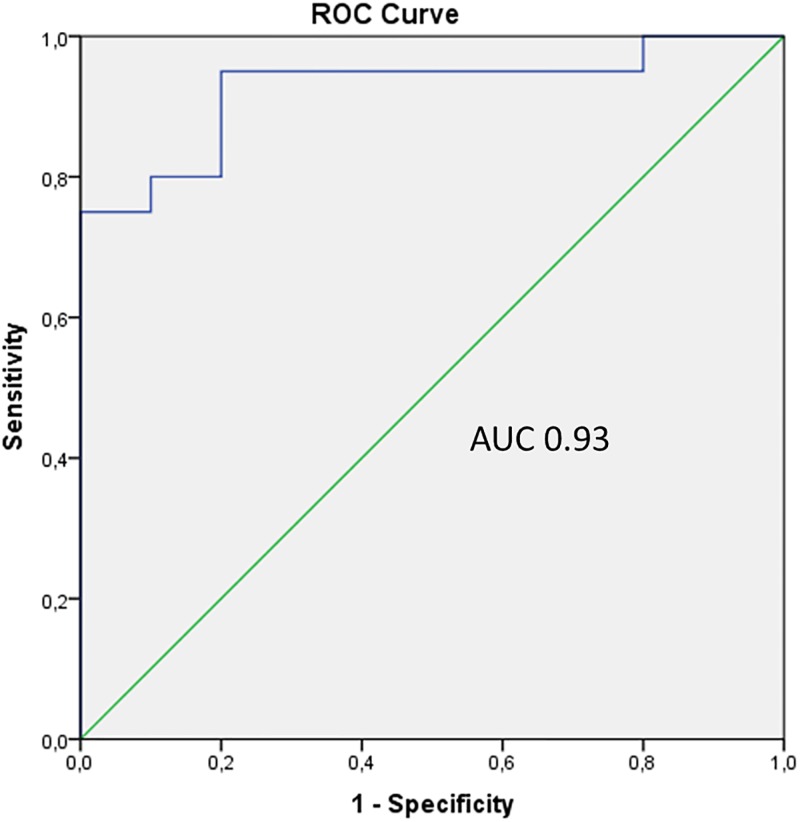
Fig 2. Diagnostic performance of the 3-protein biomarker panel in discriminating GD patients with moderate-to-severe GO from GD patients without GO.
ROC curve analysis showing LYZ, LACRT and AZGP1 combined in a panel, with an AUC of 0.93. The curve is created by plotting the true positive rate (sensitivity) against the false positive rate (1 –specificity).

