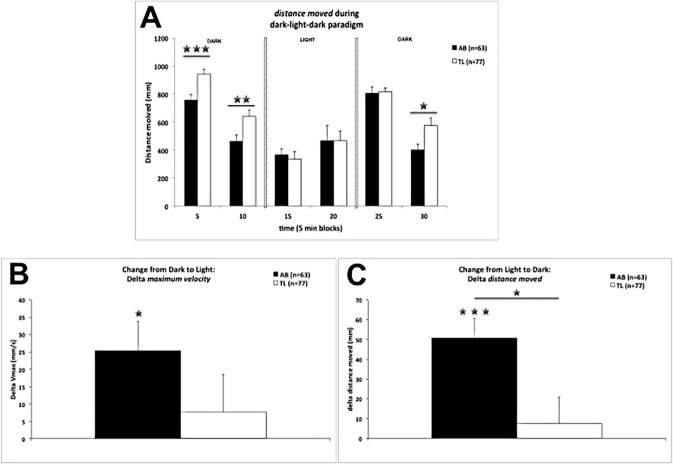
Fig 1. Dark (10 min)–light (10 min)–dark (10 min) paradigm for AB and TL larvae.
Panel A: Distance moved (means + SEMs) for AB and TL larvae across the different light-dark periods (for statistics see text; between strains: Student’s t-test; *: p ≤ 0.05, **: p ≤ 0.01, ***: p ≤ 0.001). Panel B: Change in maximum velocity (Δ of the first 30s of the light period and the last 30s of the dark period; means + SEMs) from dark to light for AB and TL larvae (statistics: values different from 0 (i.e. no change) per strain (one-sample t-test): *: p ≤ 0.05 (1-tailed values [10,11])). Panel C: Change in distance moved (Δ of the first 30s of the dark period and the last 30s of the light period; means + SEMs) from light to dark for AB and TL larvae (statistics: values different from 0 (i.e. no change) per strain (one-sample t-test): ***: p ≤ 0.001 (1-tailed values [10,11]); between strains: Student’s t-test; *: p ≤ 0.05).

