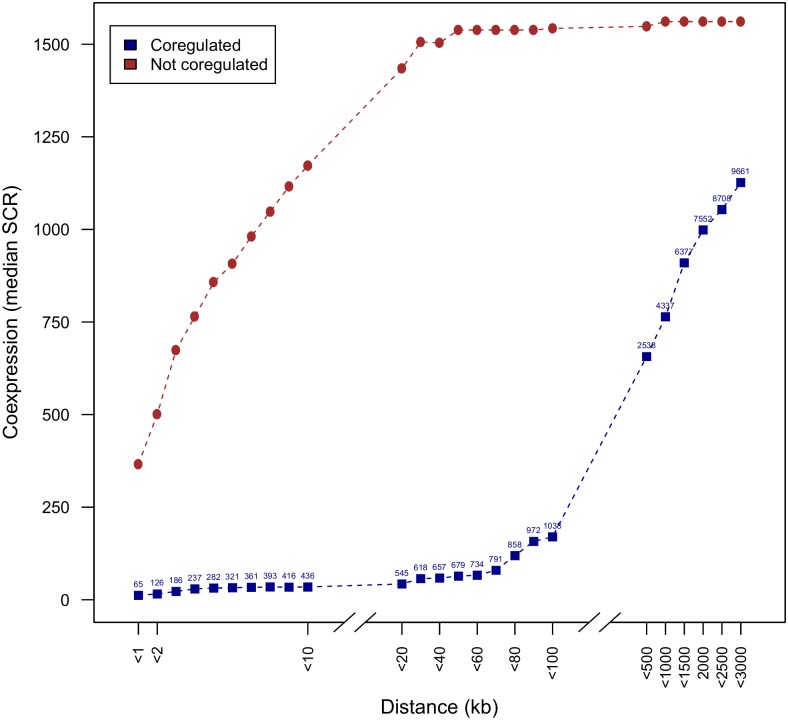
Fig 1. The distance between coregulated genes negatively influences their coexpression degree.
The plot shows the mean coexpression degree as a function of the maximum distance between two genes. The distance (x-axis) is measured by the number of kb (kilo base pairs, equal to 1000 base pairs) between the structural gene start positions of two genes. Coexpression degree (y-axis) is measured by the median SCR (a low median SCR implies high degree of coexpression) of genes with a distance lower or equal to the distance indicated on the x-axis. The effect of distance on coexpression is shown for all coregulated genes (dark-blue curve). Coexpression degree of coregulated genes can be compared to the negative control containing all genes not known to be coregulated (red curve). Note that breaks in the x-axis between distances <10 and <20 kb and between distances <100 and <500 correspond to scale differences. The numbers above each data point of the dark-blue curve represent the number of pairs of coregulated genes for which the median SCR was calculated.

