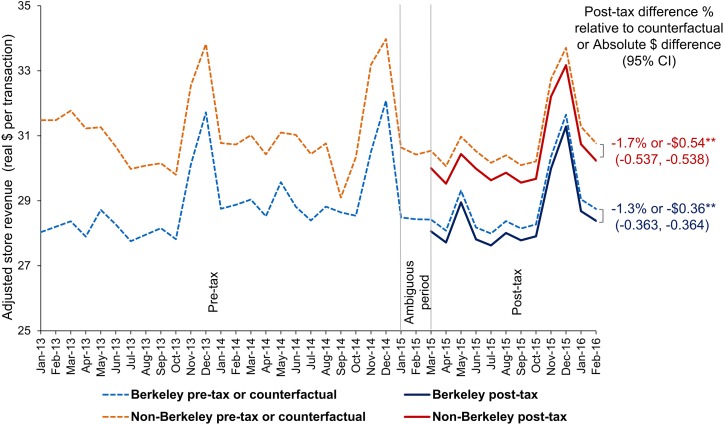
Fig 5. Point-of-sale adjusted mean store revenue/consumer spending (dollars per transaction) in Berkeley versus non-Berkeley stores.
Models account for store ID, month, year, day of week, holiday and holiday eve, a post-tax indicator, and interactions of store ID with the post-tax indicator, month, and year variables, correcting the standard errors by clustering the analyses at the city level. Revenues account for inflation. Vertical lines demarcate the pre-tax period (January 2013–December 2014), the ambiguous period (January–February 2015), and the post-tax period (March 2015–February 2016). To derive the counterfactuals, we predicted the volume of taxed and untaxed beverages sold if the post-tax indicator = 0 in March 2015–February 2016. **Statistically significant difference between the Berkeley and non-Berkeley store revenues during the post-tax period at p < 0.01. Source: point-of-sale data from two chains of large supermarkets in the Bay Area obtained by the Public Health Institute.

