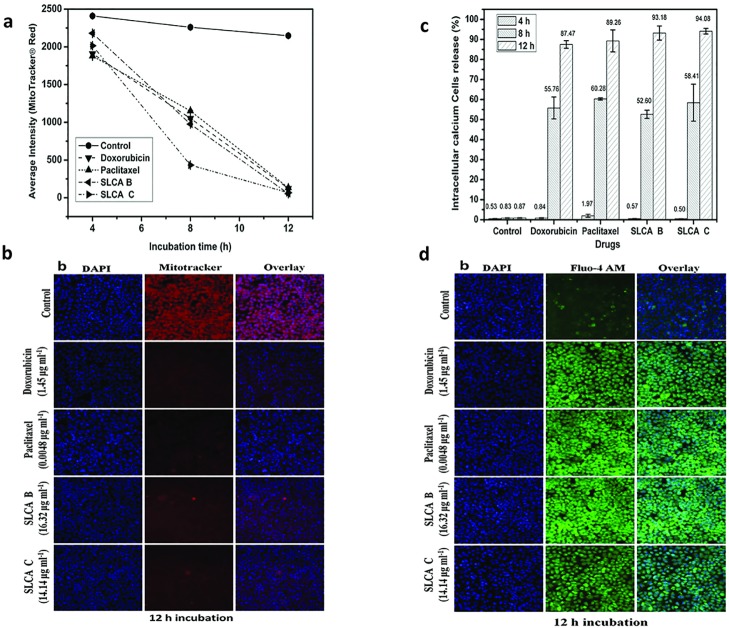
Fig 4. SLCAs decrease mitochondrial membrane potential and increase intracellular calcium in HeLa cells.
Alteration of mitochondrial transmembrane potential in sophorolipid treated HeLa cells as measured by staining with Mito Tracker Red. (a) Average dye intensity signifying depolarized cells. Data from triplicate experiments represented as mean±SD (b) Fluorescence intensity of bound dye as recorded by confocal microscope (20X magnification, scale-100 μm). Elevation in intracellular [Ca2+]i on sophorolipid treatment of HeLa cells as measured by Fluo-4AM. (c) Bar diagram represents cell percentage releasing calcium at different time intervals. (d) Overlay of confocal microscopy images exemplifying increased Fluo-4 AM intensity after 12 h that indicates increase in cytoplasmic calcium. Magnification 20X (scale, 100 μm).

