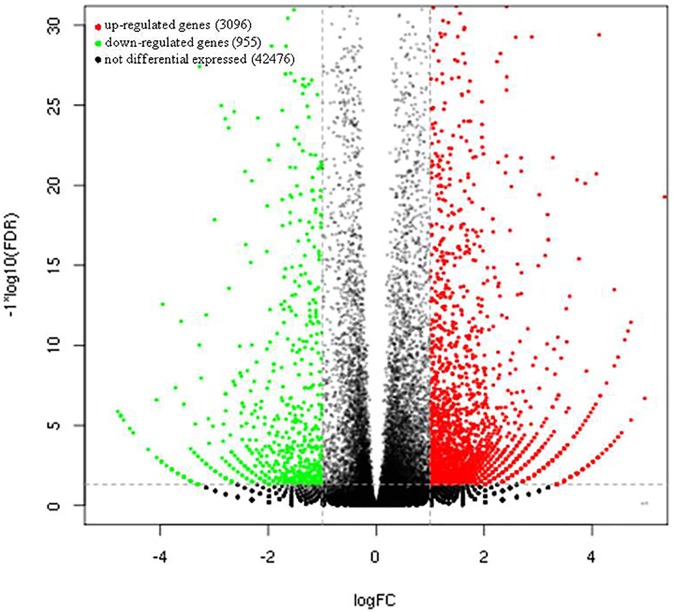
Fig 2. Volcano plots showing the comparison of DEGs between the treatment and control groups.
The red scatters indicate upregulated DEGs, green scatters indicate downregulated DEGs, and black scatters indicate no DEGs between the uniconazole-treated and untreated samples. Datasets were filtered to remove genes with low expression levels (dotted line from −1 to 1 on the x-axis), and a significance cut off (p< 0.01) was applied (dotted line on the y-axis).

