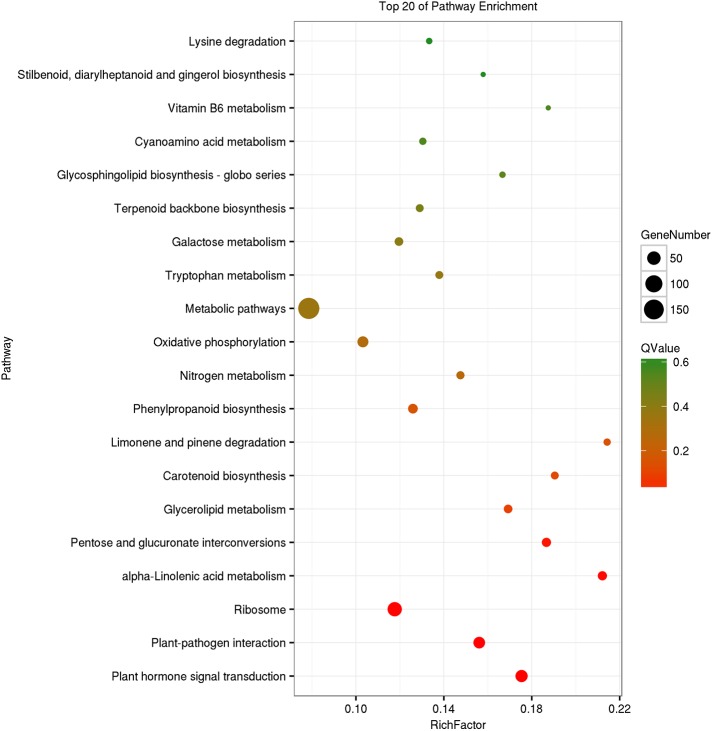
Fig 3. Functional analysis of DEGs based on the KEGG pathway.
Pathways with a Q-value ≤ 0.05 significantly enriched in DEGs were analyzed in the comparison between treatment and control at the flowering stages. The degrees of KEGG enrichment can be measured by the richness factor, Q-value, and gene number enriched in this pathway. The right y-axis represents the KEGG pathway, and the x-axis shows the richness factor, which denotes the ratio of the number of DEGs to the number of annotated genes enriched in this pathway.

