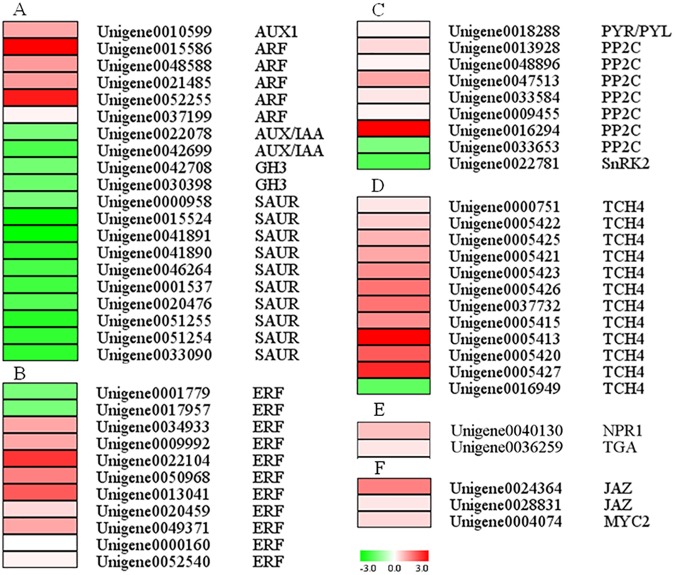
Fig 4. Heat map diagrams of relative expression levels of DEGs in the hormone signal transduction pathways.
DEGs in the signal transduction pathways identified in KEGG pathway enrichment analysis are shown as auxin (A), ethylene (B), abscisic acid brassinosteroid (C), brassinosteroid (D), salicylic acid (E), and jasmonic acid (F). Ratios are expressed as log2 RPKM (treatment/control) values. Red and green colors indicate gene upregulation and downregulation, respectively.

