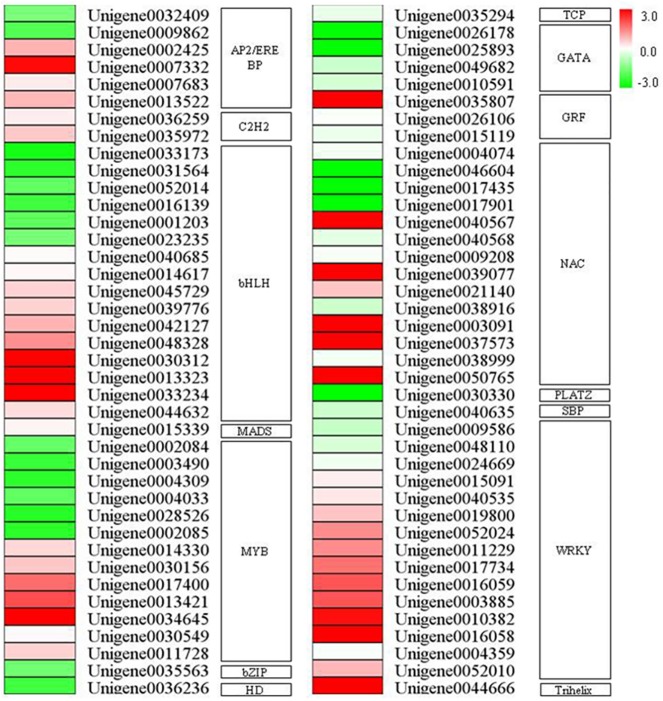
Fig 5. Differentially expressed genes encoding transcription factors following uniconazole treatment.
Different shades of red and green express the extent of change according to the color bar provided in Fig 4. Red and green indicate upregulation and downregulation of genes, respectively, whereas white indicates that no change was detected after uniconazole treatment.

