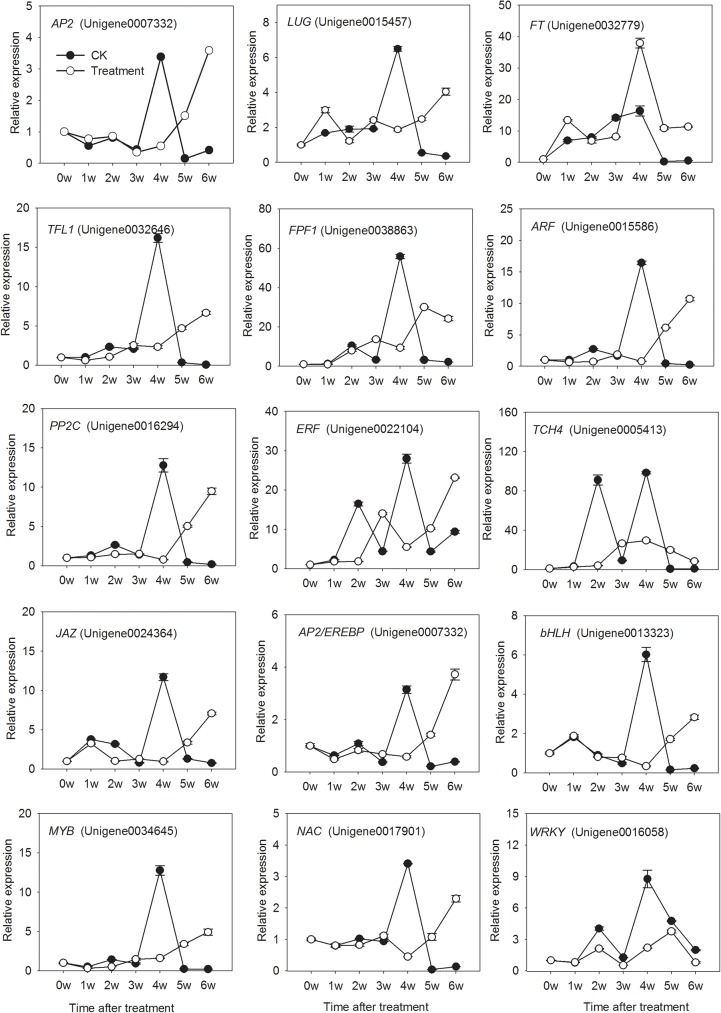
Fig 6. Verification of RNA-seq results by RT-qPCR.
Transcript levels of 15 genes, including 5 probable transcription factors, 5 flowering-related genes, and 5 genes involved in hormone signaling, as measured by RT-qPCR analyses. The relative RT-qPCR expression is shown on the y-axis to the left, with error bars representing the standard error (n = 3).

