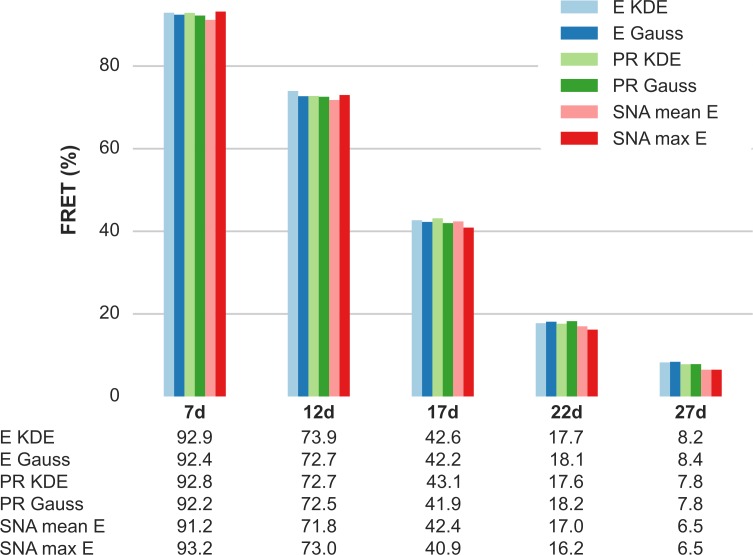
Fig 2. Single-spot μs-ALEX smFRET efficiency for 5 dsDNA samples estimated using different methods.
Population-level FRET efficiency estimated for each of the 5 dsDNA samples: 7d, 12d, 17d, 22d and 27 (the number represents the separation in base-pair between D and A dyes). FRET is estimated using the following methods. E KDE–KDE maximum from the corrected E distribution. E Gauss–Gaussian fit of the corrected E histogram. PR KDE–KDE maximum of the PR distribution, PR value converted to E. PR Gauss–Gaussian fit of the PR histogram, PR value converted to E (all previous estimation are described in Appendix 9 in S1 File). SNA mean E–Mean of the FRET distribution returned by SNA analysis. SNA max E–Mode of the FRET distribution returned by SNA analysis (SNA analysis described in Appendix 11 in S1 File). For full details on the analysis (including number of bursts and fit errors) see section of μs-ALEX: Corrected E figure of the accompanying Jupyter notebook (view online). An overview of the computational notebooks can be found in Appendix 2 in S1 File.

