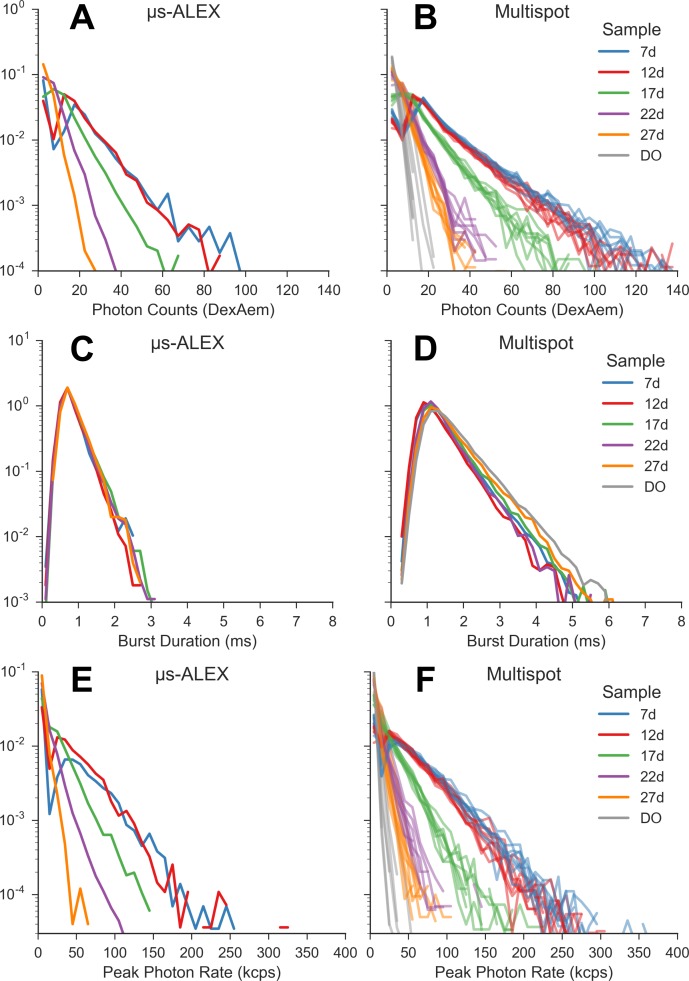
Fig 8. μs-ALEX vs multispot burst data distributions.
Distributions of acceptor counts after donor excitation, burst duration and peak photon rate in each burst for both single-spot μs-ALEX (left column) and multispot (right column) experiments. Bursts were searched using the donor-excitation stream and a constant count rate threshold (rmin = 25 kHz for both single-spot and multi-spot measurements), followed by a selection with γ-corrected burst size ≥ 15. All the distributions (i.e. histograms) are normalized so that their integral is equal to 1. For the multispot setup, acceptor counts and peak photon rates distributions (first and last row) are reported for each channel separately; for readability, for the multispot burst duration distribution (second row, right), we report the mean across the channels. For more details see section Burst statistics vs usALEX accompanying Jupyter notebook (view online).

