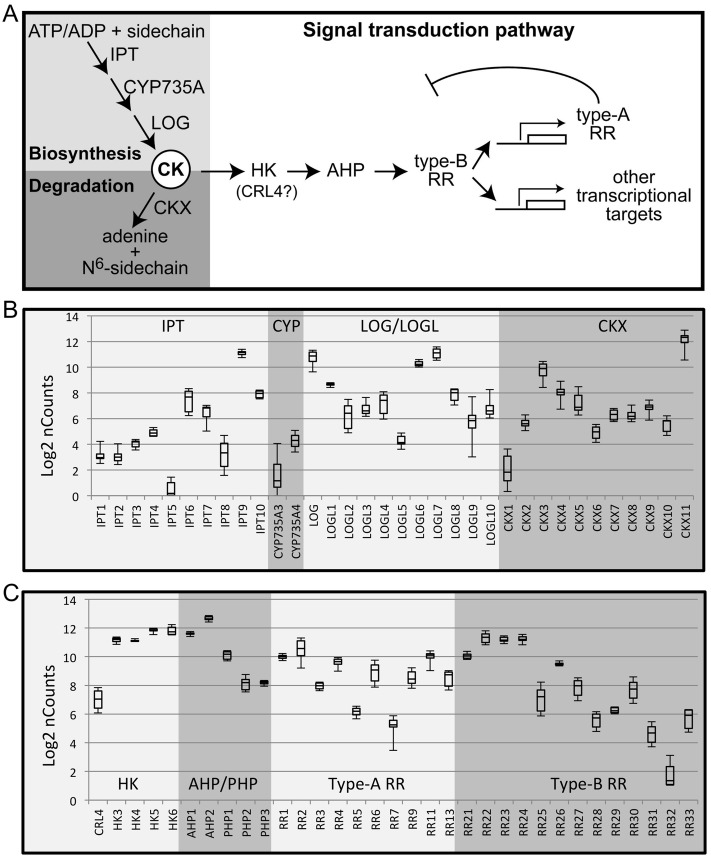
Fig 2. Differing expression levels of cytokinin-related genes in the early rice panicle based on NanoString analysis.
(A) Genes involved in cytokinin metabolism and signaling. (B, C) Box plot analysis for expression of genes involved in cytokinin metabolism (B) and signaling (C) based on NanoString analysis. Expression was analyzed for stages 0–5 of early panicle development. The bottom and top of each box indicate the 25th and 75th percentile for data expression values, the band in the middle of the box indicates the median expression value, and the ends of the whiskers indicate the minimum and maximum values. Expression values for the box-plot analysis are log2 transformed. All probes recognize single genes, except RR9 which also recognizes RR10, and RR13 which also recognizes RR8 and RR12.

