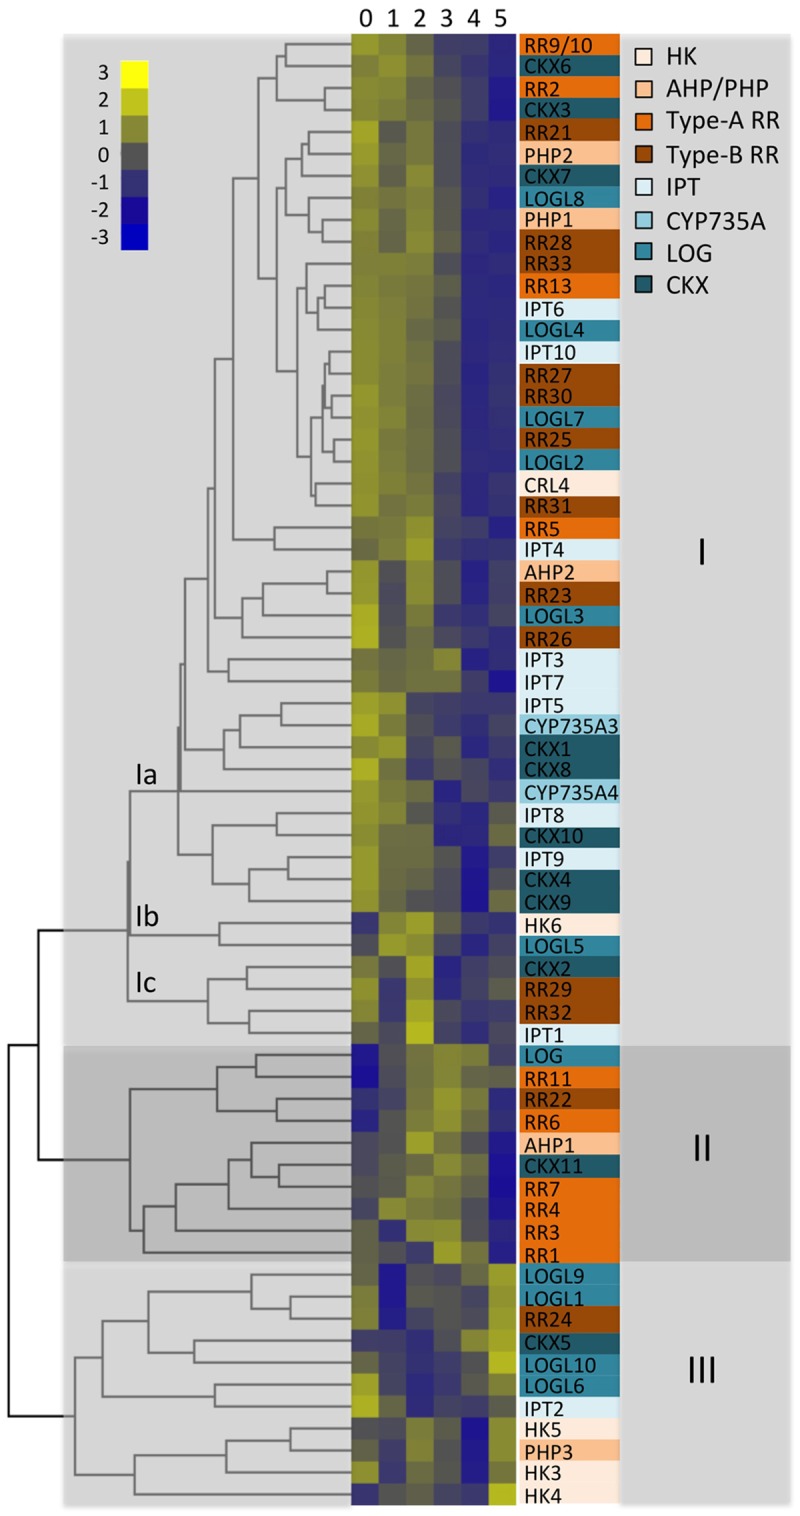
Fig 4. Dynamic changes for expression of genes involved in cytokinin action during early panicle development.

A cluster analysis was performed based on Euclidian distance between gene expression at stages 0–5 of early panicle development. This is plotted as a heat map with a dendrogram. Genes are color-coded based on whether they are involved in cytokinin metabolism (in blue) or signaling (in orange), with differing shades for each of the families involved in these processes. Genes fall into three major subfamilies (I, II, and III) based on the cluster analysis.
