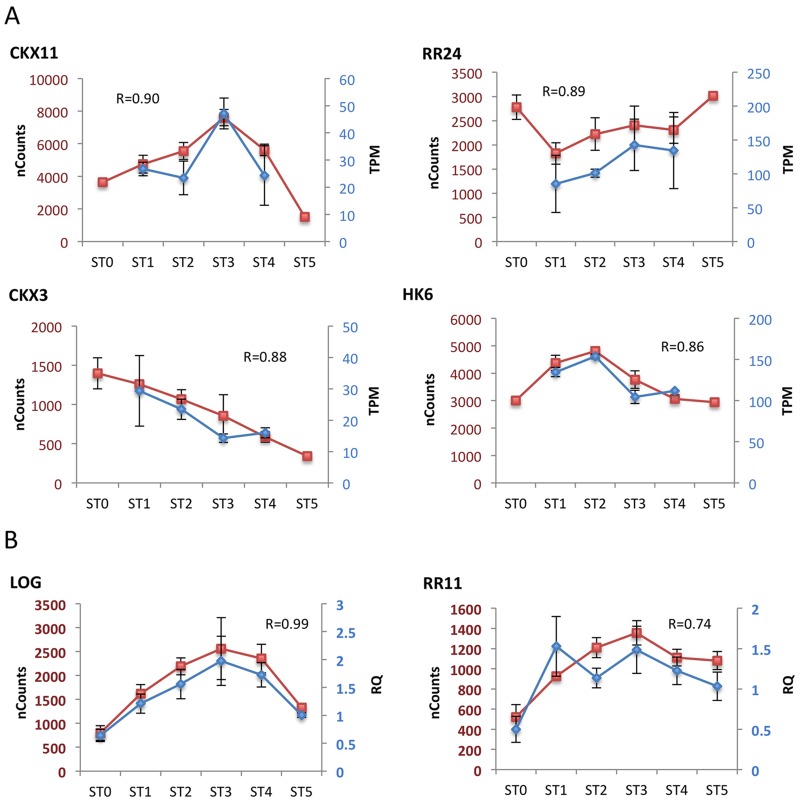
Fig 5. Confirmation of expression changes for representative genes during panicle development.
NanoString expression data is compared to expression data derived from RNA-Seq (A) or qRT-PCR (B). Genes are from subfamilies I (CKX3, HK6), II (CKX11, LOG, RR11), and III (RR24), based on the cluster analysis (Fig 4). NanoString expression is given in normalized nCounts. The RNA-Seq dataset from panicle meristems [29] covers stages 1 through 4 of early development and is given in transcripts per million (TPM). qRT-PCR data is given as a relative gene expression (RQ) based on an actin control gene.

