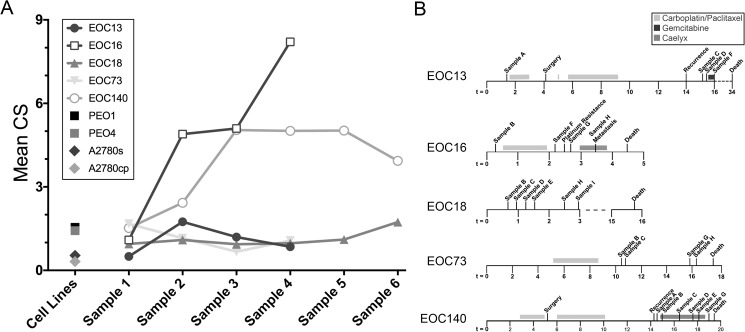
Fig 8. Mean CS Values in Primary EOC Patient Samples and Cell Line Models.
(A) Graph presenting the mCS values calculated for each patient and sample isolated from each patient, and those of the paired EOC cell line models (PEO1/PEO4 and A2780s/A2780cp). Note that the mCS value in each of the initial patient samples is <2 and remains low in all subsequent samples with the exception of EOC16 and EOC140, which exhibit striking increases in mCS values prior to succumbing to the disease. Also, note that the carboplatin resistant cell lines (PEO4 and A2780cp) both exhibit small decreases in mCS values relative to their sensitive counterparts. (B) Timelines presenting the sample collection times for each EOC patient presented in (A) relative to disease progression and treatment(s).

