
Figure 1. Upregulation of AR-bound enhancer RNAs (AR-eRNAs) in CRPC cells.
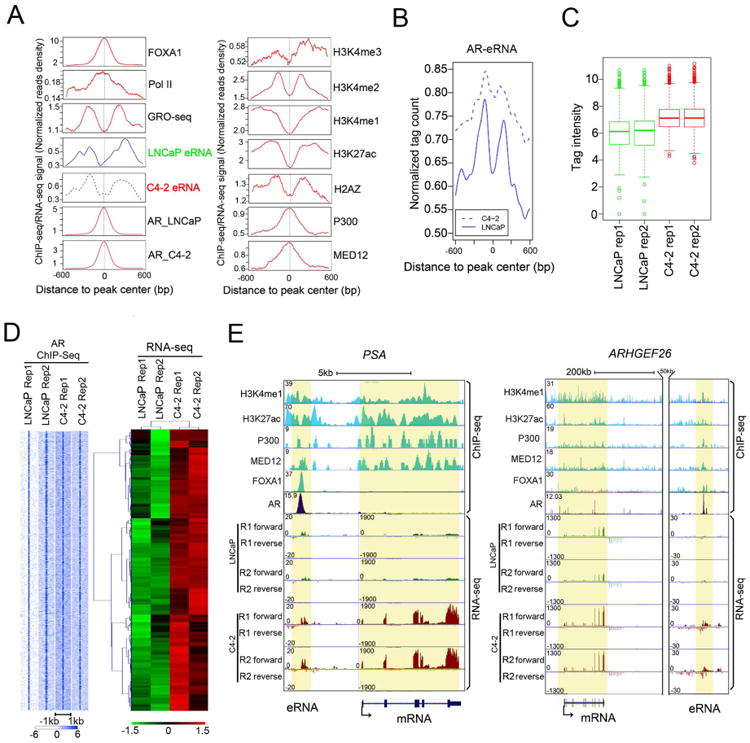
(A) Aggregate plots showing the distribution of average tags (Signal Per Million mapped Reads) of AR ChIP-seq and RNA-seq around AR binding sites in LNCaP and C4-2 cells. Other signature profiles were obtained from LNCaP cells reported previously (Wang et al., 2011).
(B) Genome-wide comparison of AR-eRNA levels between LNCaP (solid line) and C4-2 (dashed line) cells.
(C) Box and whisker plot showing AR-eRNA signals upregulated in C4-2 at 1,865 AR-bound enhancers. P < 2.2e-16 (Wilcoxon test).
(D) Heat map showing the unsupervised clustering of AR-eRNA signals upregulated in C4-2 at 1,865 AR-bound enhancers (right) and AR ChIP-seq signals within ± 1-kb windows centered on AR binding sites (left).
(E) Screen shots from the UCSC genome browser showing signal profiles of eRNA expression inLNCaP and C4-2 and ChIP-seq in LNCaP. The eRNA and mRNA regions are highlighted inyellow. PSA (left); ARHGEF26 (right).