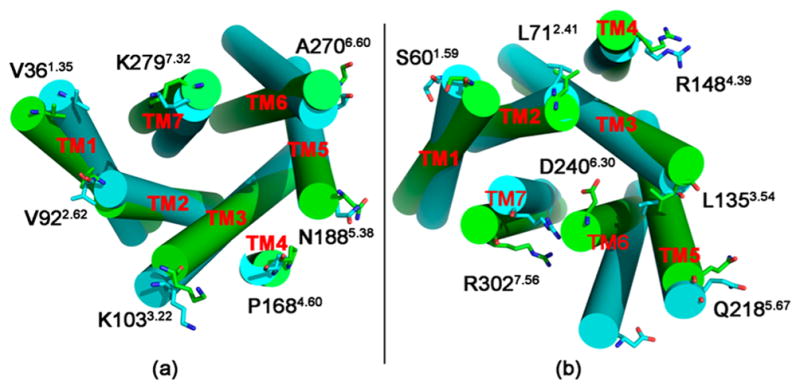
Figure 2.

Alignment of the inactive (highlighted in green) and active (highlighted in cyan) CB2 after 100 ns MD simulation, viewd from (a) the extracellular side and (b) the intracellular side. Loops have been removed for clarity, and the outermost edge residues for each transmembrane domain are given for reference and are shown as sticks.
