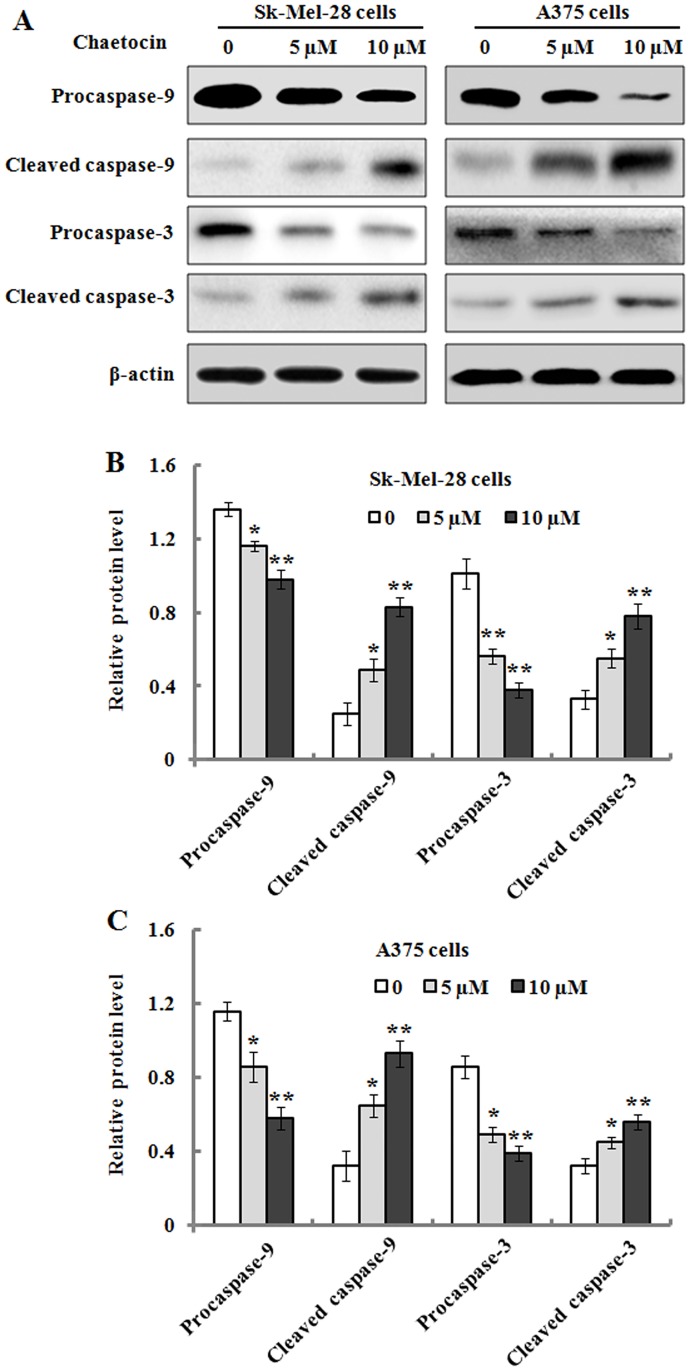
Fig 7. The effects of chaetocin treatment on the expression level of caspase-9/-3.
Sk-Mel-28 and A375 cells were treated with 0, 5 and 10 μM chaetocin for 48 h, and cellular lysates were then prepared and subjected to SDS-PAGE analysis. (A): Representative western blot images for procaspase-9, cleaved caspase-9, procaspase-3, and cleaved caspase-3. (B-C): The relative protein levels of procaspase-9, cleaved caspase-9, procaspase-3, and cleaved caspase-3 in Sk-Mel-28 (B) and A375 (C) cells were quantified by densitometry. The data are represented as means ± SEM (n = 3). *P< 0.05 and **P< 0.01, compared with the controls.

