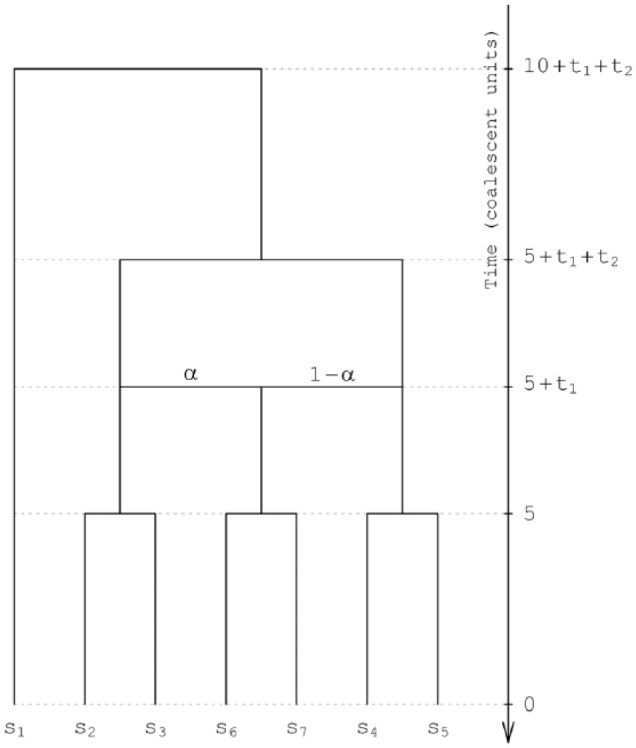
Figure 2.

Species network topology used to simulate gene genealogies. α and 1 − α denote the contributions of 2 parental species toward a hybridization event. Branch lengths in the network are measured in coalescent units, with 1 unit equal to the number of generations required on average for 2 random alleles in a population to find their common ancestor. The species are labeled s1 to s7.
