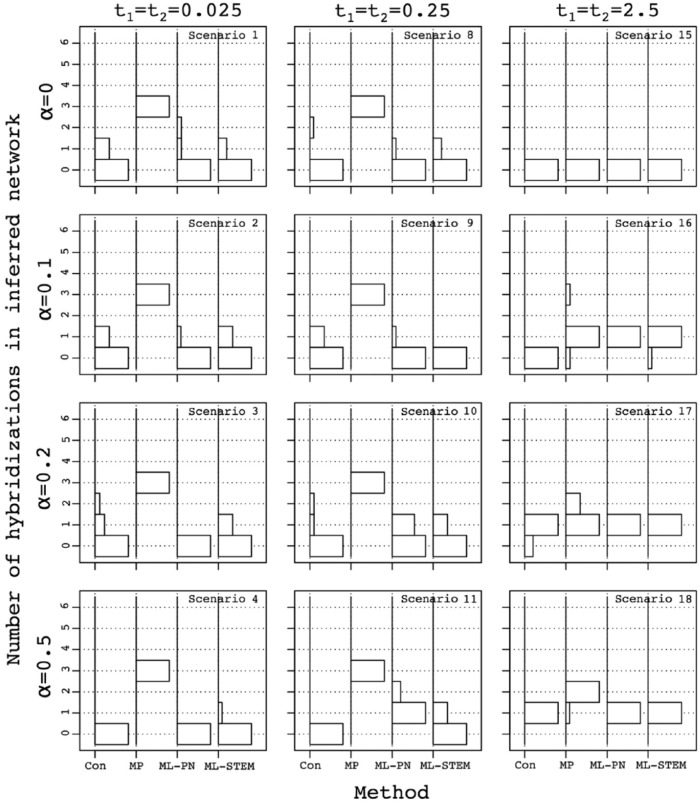
Figure 6.
Influence of the species contributions toward the hybridization event (α) on the inferred number of hybridization events in the inferred species networks. Histograms on the y-axes show the distribution of the number of hybridization events in the networks reconstructed using various species network inference methods, across 10 sets of 250 gene trees. Methods are shown on the x-axes: Con, consensus network; MP, MP network inferred using PhyloNet; ML-PN, ML network inferred using PhyloNet; ML-STEM, ML network inferred using STEM-hy. The maximum number of hybridizations was 6 and only occurred for consensus networks; in other cases, our implementation limited the maximum to 3. ML indicates maximum likelihood; MP, maximum parsimony; PN, PhyloNet.

