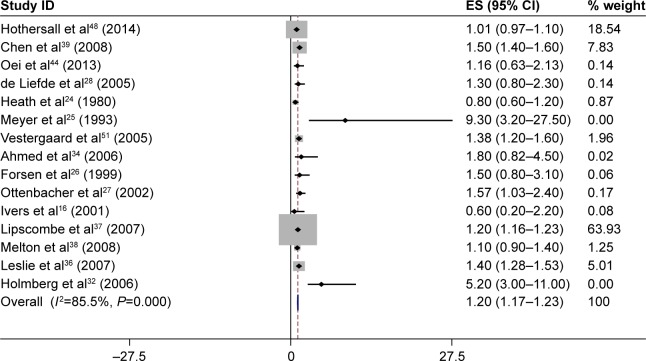
Figure 2.
The results of meta-analysis of the association between type 2 diabetes mellitus and risk of hip fracture.
Notes: Each square shows the study specific relative risk estimate. Square sizes are proportional to the weight assigned to the study in the meta-analysis and the horizontal line shows the related 95% CI. The diamond shows the summary relative risk estimate and its width represents the corresponding 95% CI. All statistical tests were two sided. Statistical heterogeneity between studies was assessed with Cochran’s Q test. Meta-analysis was performed by using a random effects method.
Abbreviations: CI, confidence interval; ES, effect size.

