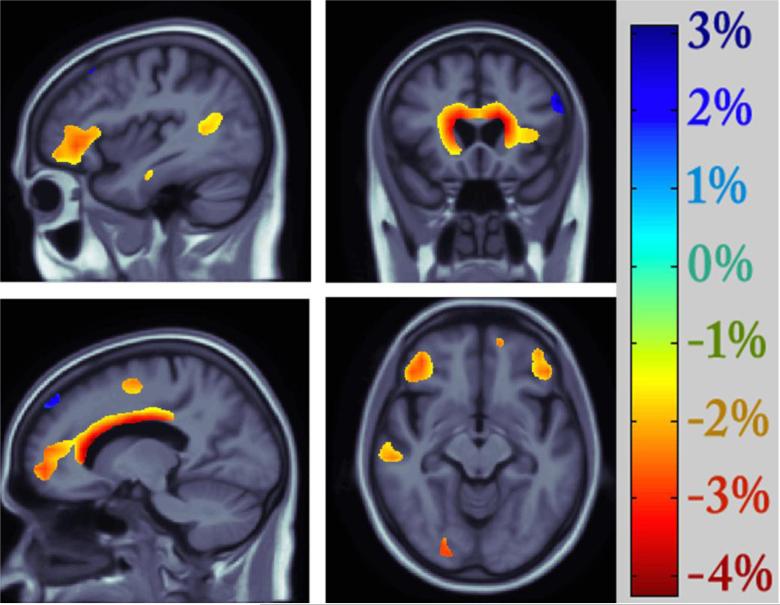
Figure 2. Effects of the C677T variant on regional brain volumes (N=738).
Negative beta values (warm colors) show regions where each risk T allele was associated with a 2-4 % volume deficit, as shown on the color bar. Tests for associations are adjusted for age, sex, and diagnosis; maps are corrected for multiple comparisons with the searchlight false discovery rate method at q=0.05. Images are in radiological convention (left side of the brain shown on the right).

