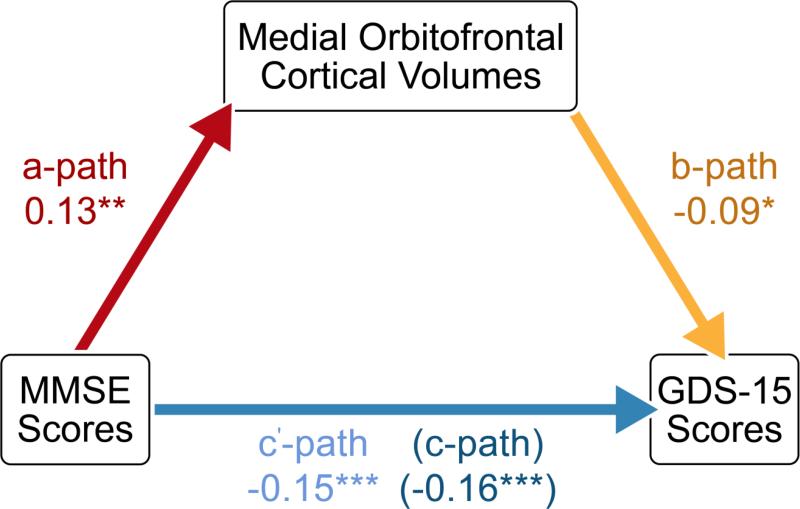
Figure 4. Mediation of the association between MMSE performance and GDS-15 scores by medial orbitofrontal volumes (N=640).
Path coefficients for simple mediation analysis using the PROCESS Procedure for SPSS. The a-path represents the association between MMSE scores and medial orbitofrontal volumes. The b-path denotes the relationship between medial orbitofrontal volumes and GDS scores, while also controlling for MMSE performance. The c’-path and the c-path represent the associations between MMSE and GDS scores with and without medial orbital cortical volumes included as a mediator, respectively. *p<0.05, **p<0.01, ***p<0.001.

