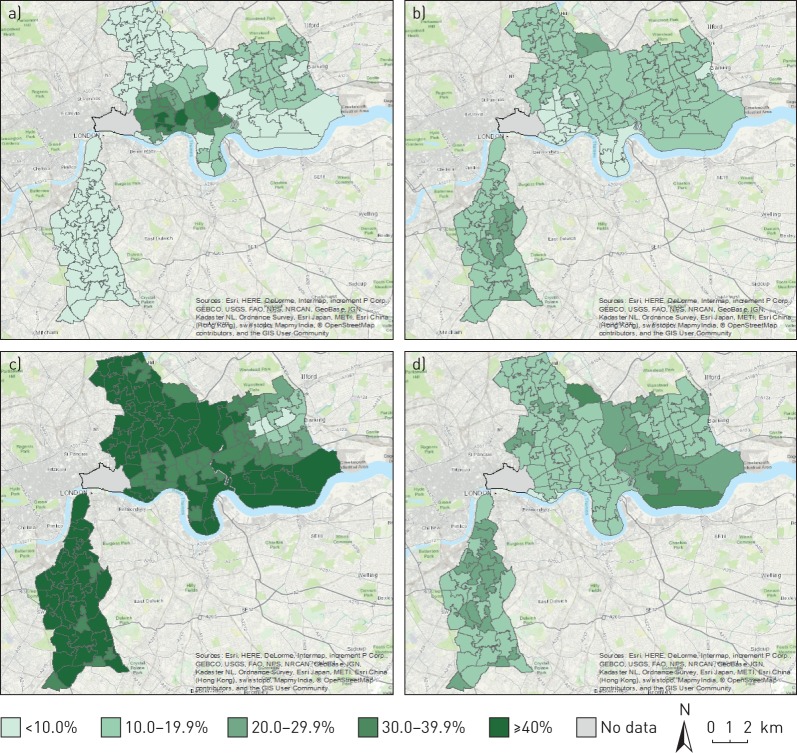
FIGURE 1.
Ethnic density distributions (%) by Middle Super Output Area mapped across south and east London for general practitioner-registered populations: a) Bangladeshi, b) Caribbean, c) White and d) African. © OpenStreetMap contributors. OpenStreetMap is open data, licensed under the Open Data Commons Open Database License by the OpenStreetMap Foundation.

