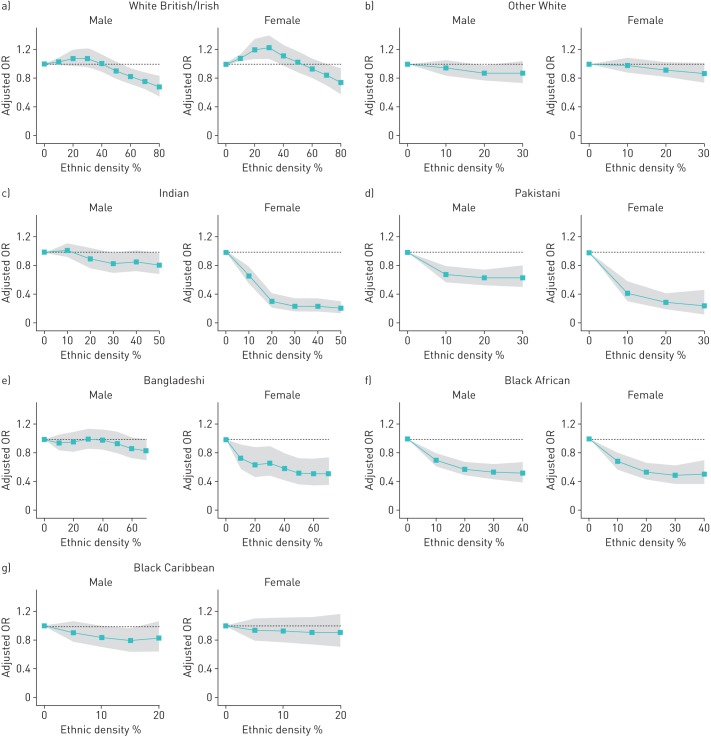
FIGURE 2.
Relationship between own-group ethnic density (expressed in 10% increments of the whole population) and the adjusted odds ratio (OR; adjusted for age, general practice, borough and Index of Multiple Deprivation score) of being a current smoker, analysed by sex and ethnic group using restricted cubic splines: a) White British/Irish, b) Other White c) Indian, d) Pakistani, e) Bangladeshi, e) Black African and f) Black Caribbean. Shaded areas show the 95% confidence intervals.

