Figure 1. Two morphologically and physiologically contrasting DG-SOMI types.
(A) Left, confocal image stack of a transverse section through the dentate gyrus (DG) of a transgenic mouse expressing GFP and somatostatin (SOM) in GABAergic interneurons (GIN; Oliva et al., 2000). Arrow, points to a GFP-positive cell intracellularly labelled with biocytin and conjugated to Alexa Fluor 647 (white cell). Right, same section showing antibody labelling against SOM. Inset, intracellularly labelled cell co-expresses GFP and SOM. Scale bar 5 µm. Arrow head points to areas of high SOM axon profile density. (B) Quantification of GFP and SOM co-localization (three mice). (C) Reconstructions of two representative intracellularly labeled DG-SOMI types. Somata and dendrites are depicted in black and axons in red. Grey lines depict layer-specific borders. From left to right, hilar perforant path-associated interneuron (HIPP), hilus-associated interneuron (HIL). Below, representative voltage traces of the two SOMI types during 1 s, −100 and 300 pA current injections. Schematics and color codes represent the respective SOMI types throughout all figures. Hilus is defined as area between the granule cell layer (gcl)-to-hilus border and the black striped line (Freund and Buzsáki, 1996). (D) Total axonal length of the two SOMI types on the basis of single-cell reconstructions in the DG (six cells each group). (E) Layer-specific axonal distribution of the two SOMIs in DG sub-areas. Red and blue circles connected by lines correspond to mean values of HIL and HIPP cells, respectively. (F–H) Summary plot of membrane resting potential (Vrest), membrane time constant (τm) and input resistance (Rin) for both interneuron types. (I,J) Summary graph of the half-duration (HD) of single action potentials (APs), the decay of single APs and the maximal discharge frequency. (K) Hierarchical cluster analysis on the basis of morphological and physiological properties of 12 reconstructed cells (depicted by triangles in F-J) reveals two DG-SOMI classes which correspond to previously denominated HIPP and HIL cells (see Materials and methods). Circles represent single data points, circles with lines are means ± SEM; ***p≤0.001, **p≤0.01, *p≤0.05. Abbreviations: gcl, granule cell layer; hil, hilus; iml, inner molecular layer; oml, outer molecular layer.

Figure 1—figure supplement 1. Morphological reconstructions of HIPP and HIL cells in the DG.

Figure 1—figure supplement 2. Morphological reconstructions of non-HIPP and non-HIL cells of the DG.

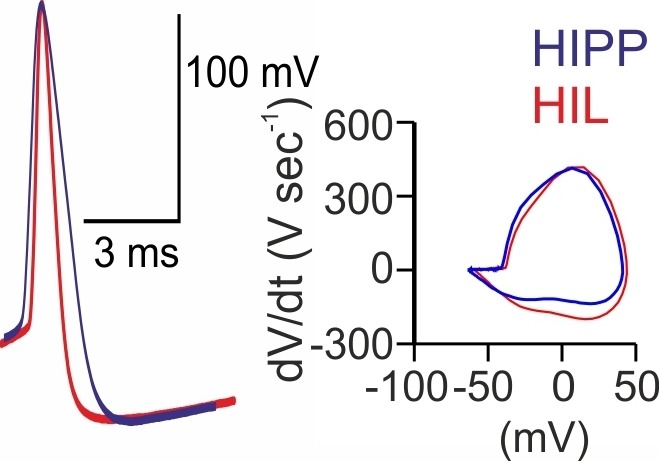
Figure 1—figure supplement 3. HIPP and HIL cells generate action potentials with different voltage trajectories.