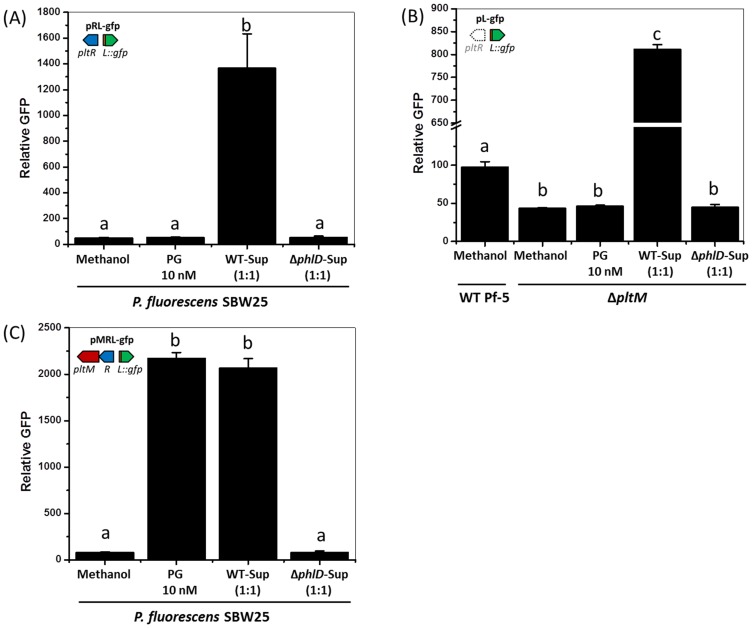
Figure 3. Effect of phloroglucinol (PG) and Pf-5 culture supernatants on expression of pltL::gfp in P. fluorescens SBW25 (A, C), and P. protegens Pf-5 (B).
(A) Expression of pltL::gfp in SBW25 containing pRL-gfp. (B) Expression of pltL::gfp in wild-type (WT) Pf-5 and the ΔphlM mutant containing pL-gfp. (C) Expression of pltL::gfp in SBW25 containing pMRL-gfp. In each experiment, the concentration of PG is 10 nM, and the same volume of methanol was added to the bacterial cultures as a control. The supernatants of bacterial cultures were mixed with the fresh bacterial cultures at a 1:1 vol ratio to test their effects on pltL::gfp expression; WT-Sup, the culture supernatants of wild-type Pf-5; ΔphlD-Sup, the culture supernatants of a ΔphlD mutant. The expression levels of pltL::gfp were measured and recorded as relative GFP (fluorescence of GFP divided by OD600). Letters above columns indicate treatments significantly different from one another, as determined by ANOVA analysis (p<0.05). Data are means of at least three biological replicates from a representative experiment repeated three times with similar results, and error bars represent the standard deviation of the mean.
DOI: http://dx.doi.org/10.7554/eLife.22835.006


