. 2017 Mar 6;6:e22835. doi: 10.7554/eLife.22835

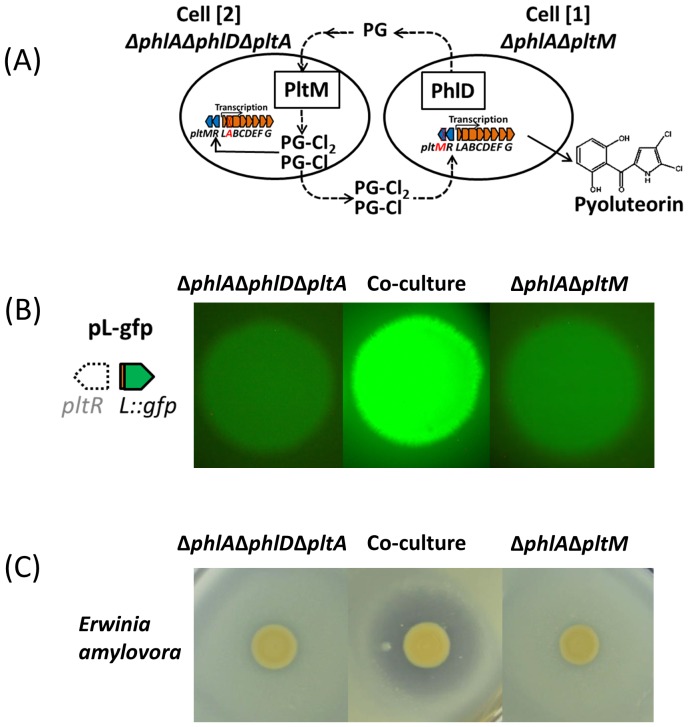
Figure 7. PG-Cl and PG-Cl2 function as cell-cell communication signals of P. protegens Pf-5.

(A) Proposed cell-cell communication model. Cell [1] (ΔphlAΔpltM) produces phloroglucinol (PG) and releases it into the environment. PG is taken up by cell [2] (ΔphlAΔphlDΔpltA) and converted into PG-Cl and PG-Cl2, which are secreted into the environment. PG-Cl and PG-Cl2 are taken up by cell [1] and induce expression of pyoluteorin biosynthetic genes and production of pyoluteorin by cell [1]. The plt gene cluster is shown. Red font indicates that the gene was deleted. (B) GFP expression from the pure- and co-culture of the ΔphlAΔpltM mutant containing pL-gfp and the ΔphlAΔphlDΔpltA mutant containing pL-gfp on NAGly plate. (C) Antibiosis of the pure- and co-culture of the ΔphlAΔpltM mutant and ΔphlAΔphlDΔpltA mutant against growth of Erwinia amylovora on a NAGly plate. The co-culture was prepared by mixing the two mutants 1:1 and spotting on the plate. The experiment was repeated at least twice, with similar results.

DOI: http://dx.doi.org/10.7554/eLife.22835.026

Figure 7.

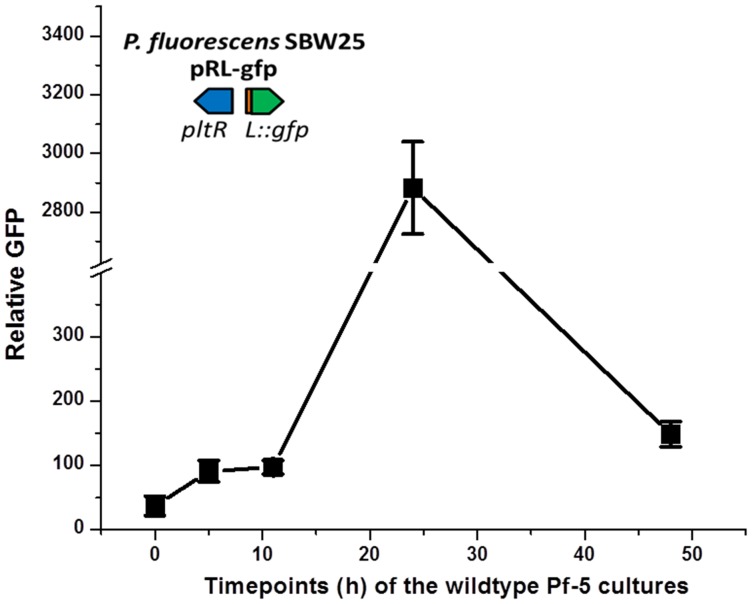
Figure 7—figure supplement 1. Levels of signaling compounds in cultures of P. protegens Pf-5 of different ages.

Figure 7—figure supplement 1.

Relative levels of signaling compounds that induce pltL expression were determined from extracts of Pf-5 culture supernatants by assessing GFP expressed by P. fluorescens SBW25 containing the reporter construct pRL-gfp. Cultures of wild-type Pf-5 were grown in 5 ml NBGly for different times, as indicated. Data are means of three biological replicates from a representative experiment repeated three times with similar results, and error bars represent the standard deviation of the mean.
Figure 7—figure supplement 1—source data 1. Expression of pltL::gfp by SBW25 in response to extracts of wild-type Pf-5 cultures.
Pf-5 wild-type was cultured for different times, as indicated. The culture extracts were tested by SBW25 containing pRL-gfp.
DOI: 10.7554/eLife.22835.028
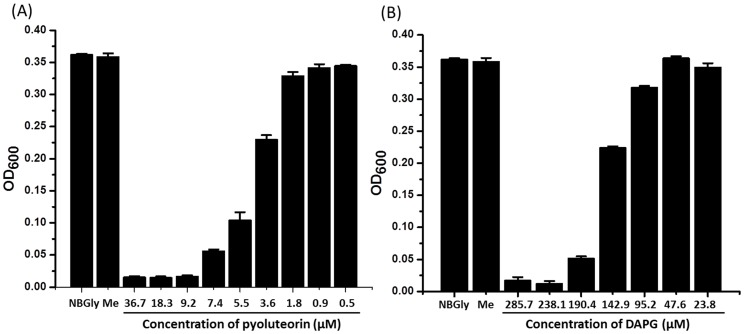
Figure 7—figure supplement 2. Toxicity of pyoluteorin (A) and DAPG (B) to the plant pathogen Erwinia amylovora.

Figure 7—figure supplement 2.

Erwinia amylovora was cultured in NBGly broth for 24 hr in a 96-well plate with or without the tested compounds. The final concentrations of the tested compounds are indicated. The growth of the bacteria was monitored by measuring the value of OD600 of the bacterial cultures. Me, negative control composed of a culture amended with the same volume of methanol used in cultures amended with pyoluteorin or DAPG. Data are means of three biological replicates from a representative experiment repeated two times with similar results, and error bars represent the standard deviation of the mean.
Figure 7—figure supplement 2—source data 1. Growth of Erwinia amylovora in response to pyoluteorin and DAPG.
DOI: 10.7554/eLife.22835.030