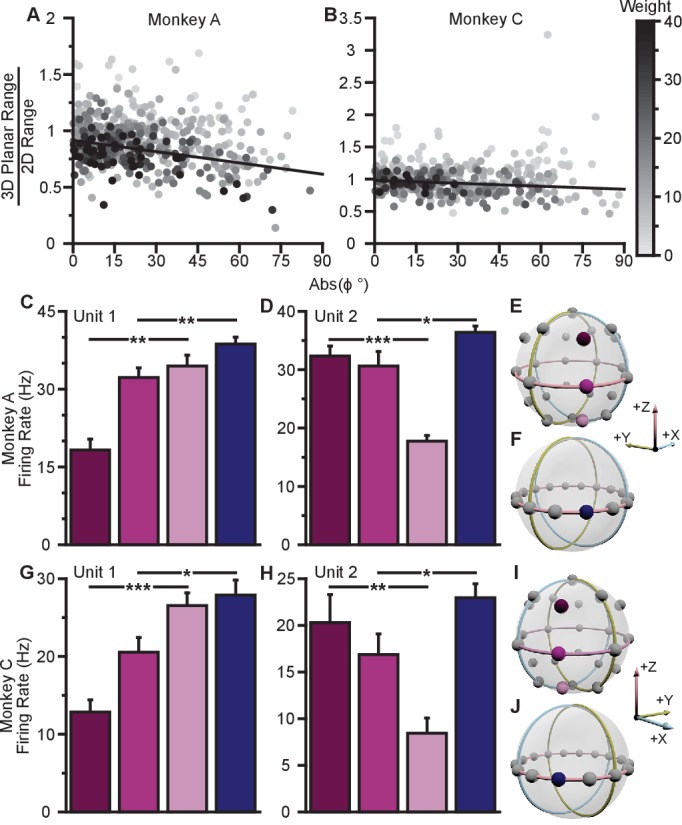
Figure 4. Evidence for dynamic range adaptation.
(A) Dose-response effects in the tuning changes for Monkey A. (B) Dose-response effects in the tuning changes for Monkey C. The ratio of 3D planar to 2D dynamic ranges are plotted against the absolute value of the elevation angle () of the PD vectors. The weighted linear fits for the data points are shown in black. The fits have negative slopes. , , , , , , , , slope, , -test versus constant model, , number of analyzed units. The darkness of the points corresponds to the weights used for the linear fits with the legend shown to the right. To provide contrast, the upper threshold of colormap for the weights was set at 40. The tuning curves for the two points that lie significantly off the trend line in (B) are shown in Figure 4—figure supplement 1B. (C,D) Firing rates from Monkey A for the first two units from Figure 2A. Both units have an azimuthal PD near . The first three bars show the firing rates in the 3D context for the target that lay at on the xy-plane (pink) and the two targets immediately above (dark pink), and below (light pink) that target (E). The firing rate in the 2D context to the target at is shown in the fourth bar (F). Unit 1 had a preferred direction below the xy-plane (, **). Unit 2 had a preferred direction above the xy-plane (, ***). Despite this difference, both units showed an increased firing rate to the planar target in the 2D context compared to the 3D context (, **, , *). (G,H) Similar set of firing rates from Monkey C for the first two units from Figure 2B. The corresponding targets are shown in (I and J). Both units had an azimuthal PD near . Unit 1 had a preferred direction below the xy-plane , ***). Unit 2 had a preferred direction above the xy-plane (, **). Despite this difference, both units showed an increased firing rate to the planar target in the 2D context compared to the 3D context (, *, , *). The firing rates are plotted as the mean SE (, Mann-Whitney tests, and trials are the same from Figure 2A,B). Data to recreate these plots are available in Figure 4—source data 1.
DOI: http://dx.doi.org/10.7554/eLife.21409.018

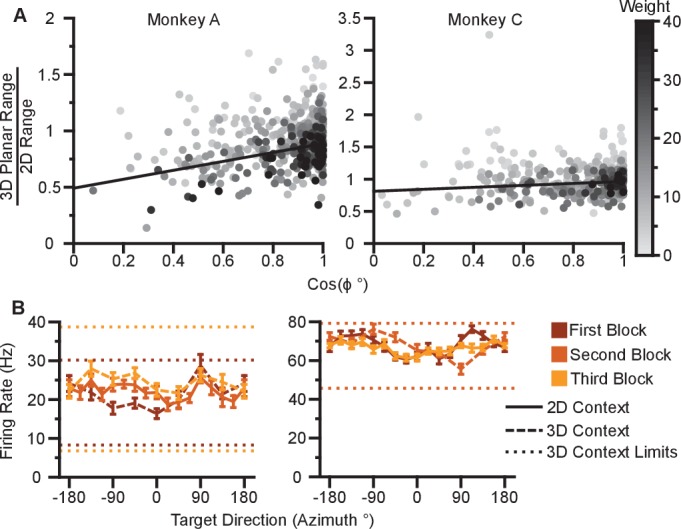
Figure 4—figure supplement 1. Dose-response effects in firing rate changes.

