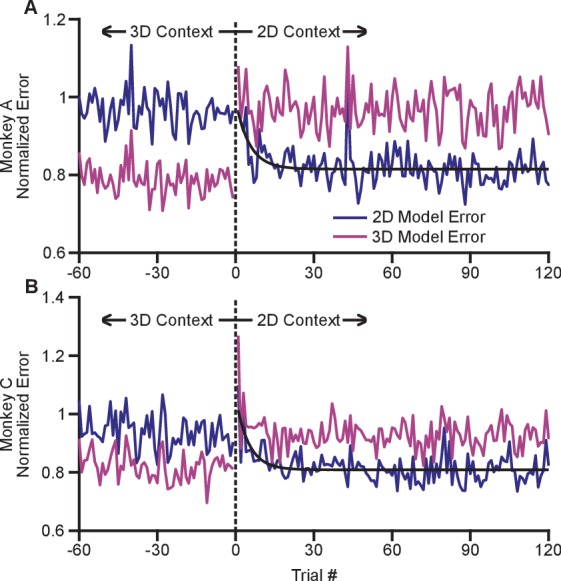
Figure 5. Time course of adaptation.

The two panels show the time courses of adaptation for Monkey A (A) and Monkey B (B). The ordinate axes in the plots show the standardized error between the firing rates in the population and the expected response from tuning fits. Each plot shows two different errors: the error based on tuning models from the 2D context (dark blue) and from the 3D context (pink). These standardized errors are averaged across multiple recording sessions for Monkey A (18) and Monkey C (11). The abscissa in the plots show the trial number before and after the change from the 3D context to the 2D context. The data points to the right of zero represent the standardized error for the first 120 trials in the 2D context. The data points to the left of zero represent the last 60 planar target trials of the the 3D context. The dashed black vertical line at zero represents the system down-time while the context was switched. We also plotted exponential fits (black) to the 2D tuning model error for the first 120 trials of the 2D context. The data were fit to the equation: . For Monkey A, the fit parameters (with 95% confidence bounds) were: a = 0.815(0.807, 0.8233); b = 0.176(0.087, 0.264); c = −0.189(−0.317, −0.060); r2 = 0.229. For Monkey C, the fit parameters were: a = 0.809(0.800,0.818); b = 0.250(0.150, 0.348); c = −0.202(−0.309, −0.095); r2 = 0.328. Data to recreate these plots is available in Figure 5—source data 1.
DOI: http://dx.doi.org/10.7554/eLife.21409.022
