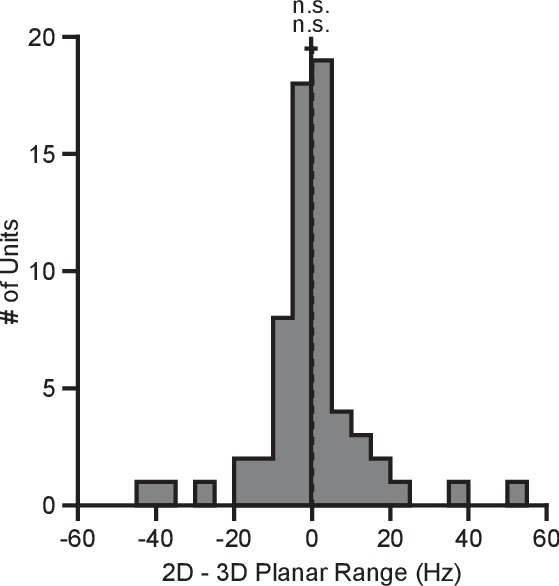
Figure 7. Tuning range in hand-control task.

The plot shows the histogram of the tuning range difference between the 2D and 3D contexts for the planar targets in the hand-control task. For the plot: solid vertical line, mean of distribution; solid horizontal line, mean SE; dashed vertical line, point of equality between the two tuning ranges. For Monkey N, the tuning ranges were not significantly different between the 2D and 3D contexts (n.s., Wilcoxon signed-rank test, , n.s., , units). Data to recreate these plots are available in Figure 7—source data 1.
DOI: http://dx.doi.org/10.7554/eLife.21409.026
