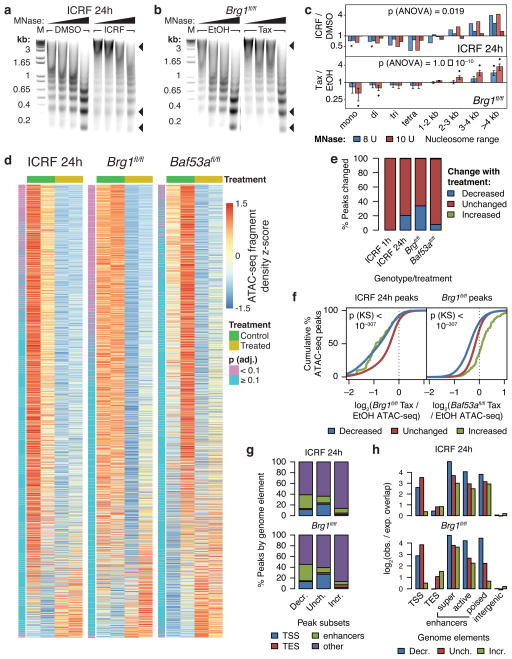
Figure 3. TOP2 and BAF promote accessibility of enhancers and promoters genome-wide.
DNA gel electrophoresis of MNase digests of ES cells treated with 1 μM ICRF-193 for 24 hours (a) or Brg1fl/fl; actin-CreER (b) ES cells treated with tamoxifen (Tax) to knockout Brg1 using 6, 8, 10, or 12 units of MNase. Arrowheads point to different nucleosome species. M: DNA marker. Uncropped gel images are shown in Supplementary Data Set 1. (c) Fold-change densitometry of MNase digests in log-scale. Significance of treatment assessed by t-tests as before. Overall significance of the interaction effect of treatment and size range assessed by three-way ANOVA. Bars represent actual values from 2 cell passages (ICRF) or means (Brg1fl/fl) and error bars represent s.e.m. from 4 cell passages. (d) Row-wise z-score heatmaps of ATAC-seq fragment density at ATAC-seq peaks sorted by edgeR-adjusted fold-change. (e) Percentage of ATAC-seq peaks altered upon ICRF-193 or tamoxifen treatment. (f) Cumulative probability distributions of specified log2 fold-change ATAC-seq fragment density over specified ATAC-seq peaks. Significance between “Decreased” and “Unchanged” distributions assessed by Kolmogorov-Smirnov tests. (g) Classification of ATAC-seq peaks by genome element. (h) log2 observed/expected overlap of ATAC-seq peaks by genome elements.

