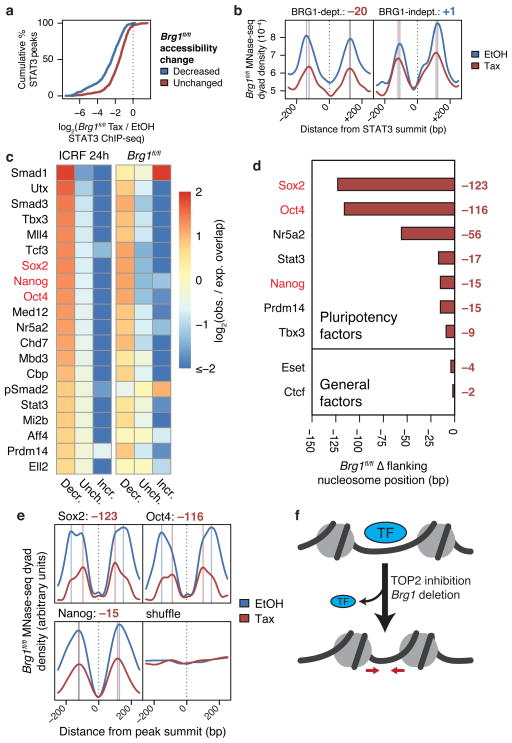
Figure 5. TOP2 and BAF are required for recruitment of pluripotency factors genome-wide.
(a) Cumulative probability distributions of log2 fold-change STAT3 ChIP-seq fragment density in Brg1fl/fl ES cells at STAT3 peaks overlapping specified ATAC-seq peaks. (b) MNase-seq nucleosome dyad density across specified subsets of linker-bound STAT3 sites in Brg1fl/fl ES cells. Vertical lines indicate nucleosome positions and values are changes in nucleosome positioning (bp, tamoxifen – EtOH). (c) Heatmap of log2 observed/expected change in accessibility of accessible ChIP-seq peaks from various datasets, sorted by enrichment for decreased accessibility upon ICRF-193 treatment. Top 20 ChIP-seq datasets are shown. Changes in Brg1fl/fl MNase-seq mean flanking nucleosome positions (d) and nucleosome dyad density profiles (e) around specified linker-bound ChIP-seq peaks or 38,864 randomly shuffled sites that exclude TSSs, TESs, or enhancers. (f) Model for loss accessibility, nucleosome spacing, and transcription factor binding.

