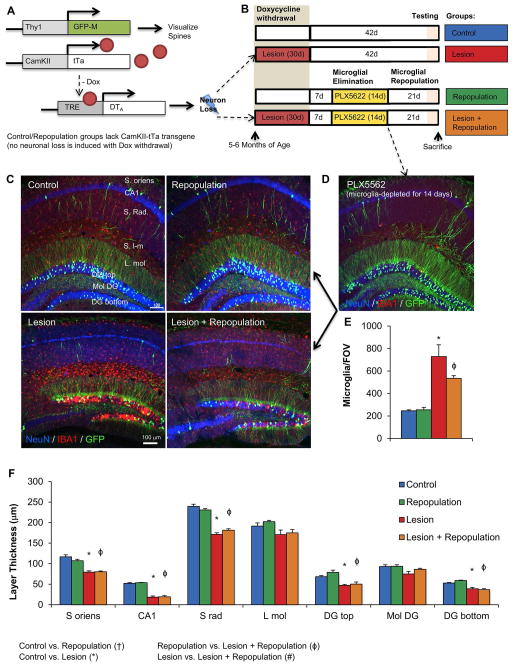
Figure 2. Neuronal lesioning followed by subsequent microglial repopulation in CaM/Tet-GFP mice.
A, Schematic depicting the mouse transgenes. B, Schematic depicting the treatment paradigm and resulting experimental groups. C, Representative images of hippocampal regions, with IBA1 (red; microglia), NeuN (blue; neuronal nuclei), and GFP (green; GFP transgene in sparse neuronal populations), from Control, Control + Repopulation, Lesion, and Lesion + Repopulation groups. D, Representative image of mice sacrificed after 14 days of treatment with PLX5622, showing microglial depletion. E, Quantification of IBA1+ cell bodies per field of view, showing increased microglial numbers following lesioning. F, Quantification of neuronal layer thickness, via NeuN immunoreactivity. Error bars represent SEM, (n=9–11). Symbols denote significant differences between groups (p<0.05): † Control vs. PLX3397; * Control vs. Lesion; ϕ PLX3397 vs. Lesion + PLX3397; # Lesion vs. Lesion + PLX3397. S. oriens, stratum oriens; CA, cornus ammonis; S. Rad., stratum radiatum; L. mol., molecular layer; DG, dentate gyrus.

