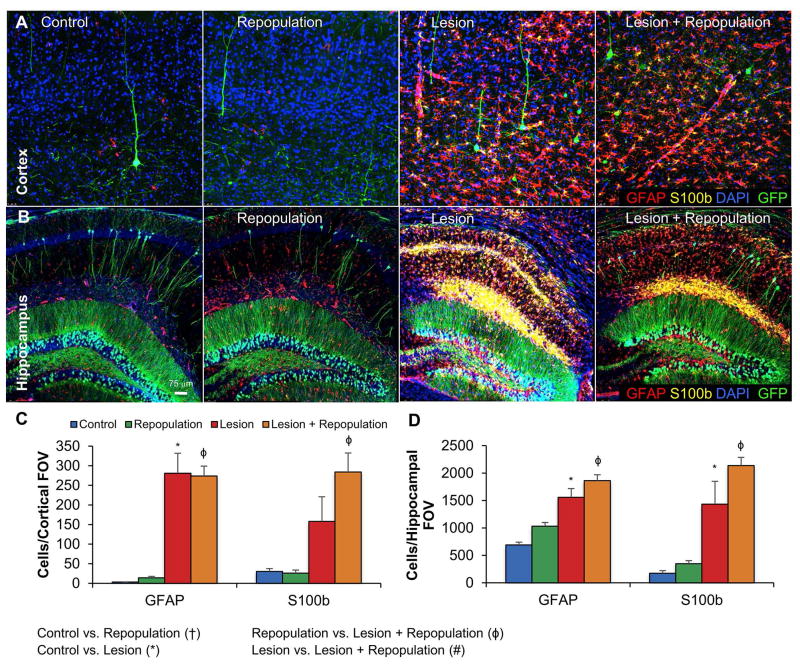
Figure 4. Lesion-induced astrocytic responses are not affected by microglial repopulation.
Astrocyte numbers and reactivity were assessed in the hippocampus (A) and cortex (B). Representative images shown with GFAP (red; astrocytes), S100b (yellow; astrocytes), GFP (green; GFP transgene in sparse neuronal populations), and DAPI (blue; nuclei), from Control, Control + Repopulation, Lesion, and Lesion + Repopulation groups. C, Quantification of (A). D, Quantification of (B). Error bars represent SEM. (n=7–10/group). Symbols denote significant differences between groups (p<0.05): † Control vs. PLX3397; * Control vs. Lesion; ϕ PLX3397 vs. Lesion + PLX3397; # Lesion vs. Lesion + PLX3397.

