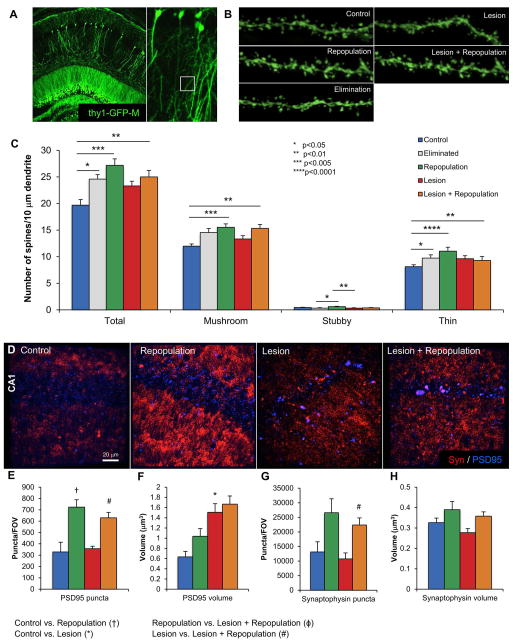
Figure 5. Microglial repopulation results in increased dendritic spine density.
A, Representative image of sparse GFP expressing neurons in the hippocampus as a result of the Thy1-GFP-M transgene. White box illustrates the non-primary apical dendrites from the CA1 neurons that are imaged at high power and quantified. B, Representative images of dendrites from Control, Elimination, Repopulation, Lesion, and Lesion + Repopulation obtained with z-stacks and then deconvoluted. C, Quantification of dendritic spine densities revealing significant increases in Total, Mushroom, and Thin spines with microglial repopulation. Spine numbers are normalized to 10 μm of dendrite length. D, Representative flattened z-stack images of PSD95 and synaptophysin immunoreactivity in the CA1 region display alterations in puncta area and size. Quantification of PSD95 puncta number (E) and volume (F) shows that microglial repopulation increases puncta numbers, while lesion increases puncta volume. Quantification of synaptophysin puncta number (G) and volume (H) shows that microglial repopulation increases puncta numbers, with no significant effects on puncta volume. Error bars indicate SEM, (n=7–10/group). Symbols denote significant differences between groups (p<0.05): † Control vs. PLX3397; * Control vs. Lesion; ϕ PLX3397 vs. Lesion + PLX3397; # Lesion vs. Lesion + PLX3397.

