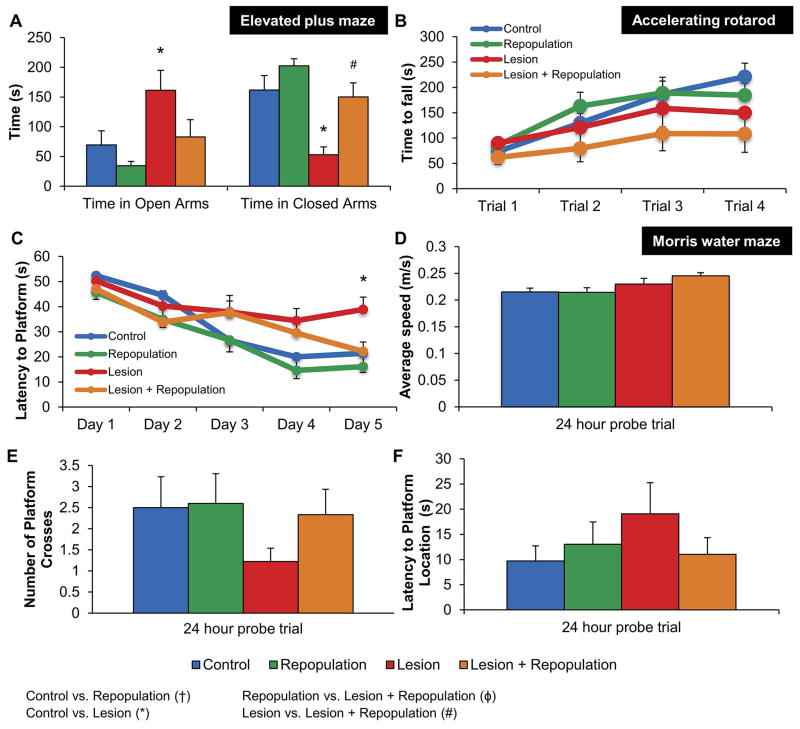
Figure 6. Microglial repopulation restores lesion-induced deficits on behavioral tasks.
A, Elevated plus maze shows Lesion mice spend significantly more time in open arms and less time in closed arms, but Lesion + Repopulation mice perform identically to controls. B, Accelerating rotarod shows that lesioned mice exhibit significantly shorter times to fall during. C, Morris water maze training shows that Lesion mice take significantly more time to find the platform, compared to Control after 5 days of training. However, Lesion + Repopulation mice perform similar to control groups. D–F, Morris water maze probe trial was performed 24 hours after last training session. D, No significant differences in swim speed exist among groups of mice. E, Lesion group mice trend to have fewer platform crosses than the other groups. F, Lesion group mice trend to have increased latencies to the platform location than the other groups. Error bars represent SEM, (n=9–11). Symbols denote significant differences between groups (p<0.05): † Control vs. PLX3397; * Control vs. Lesion; ϕ PLX3397 vs. Lesion + PLX3397; # Lesion vs. Lesion + PLX3397.

