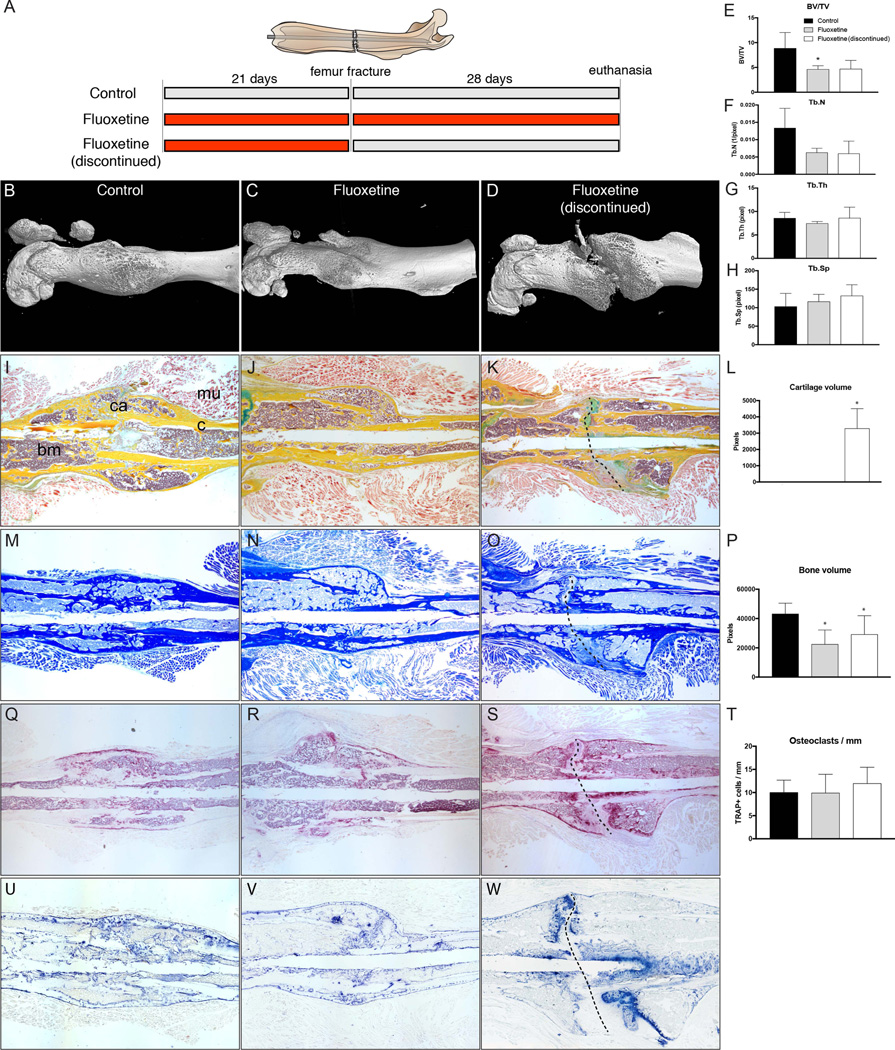
Fig. 7.
Discontinuation of fluoxetine treatment results in bony non-union in femoral fracture model. (A) Schematic representing the three experimental groups. (B–H) µCT analyses of femur fractures in control, fluoxetine treated, and fluoxetine-discontinued animals showing prolonged effect of SSRI on bone healing and incomplete fracture healing with callus gap (n = 4, p < 0.05). (I–K) Pentachrome staining of representative section showing fibrous non-union formation (dotted line in K, O, S, W) in the drug cessation group. (L) Histomorphometric evaluation of the callus reveals persistent cartilage at POD 28 in the fluoxetine-discontinued group (n = 4, p < 0.05). (M–P) Aniline blue staining demonstrating bony regenerate size in the three experimental groups. Histomorphometry shows mild increase in bone formation, but still significantly below the control (n = 4, p < 0.05). (Q–T) TRAP staining and analysis confirmed that the phenotype is not caused by an increase in osteoclastic resorption (n = 4, p < 0.04). (U, V) Alkaline phosphatase staining indicating ongoing osteogenic differentiation, with increased staining at the ossification front within the persistent fracture gap (W, dotted line). Scale bar = 2 mm. Asterisk denotes statistical significance (p < 0.05). bm = bone marrow; BV/TV = bone volume/total volume; c = cortical bone; ca = callus; d = day; mu = muscle; POD = postoperative day; Tb.N = trabecular number; Tb.Sp = trabecular spacing; Tb.Th = trabecular thickness.

