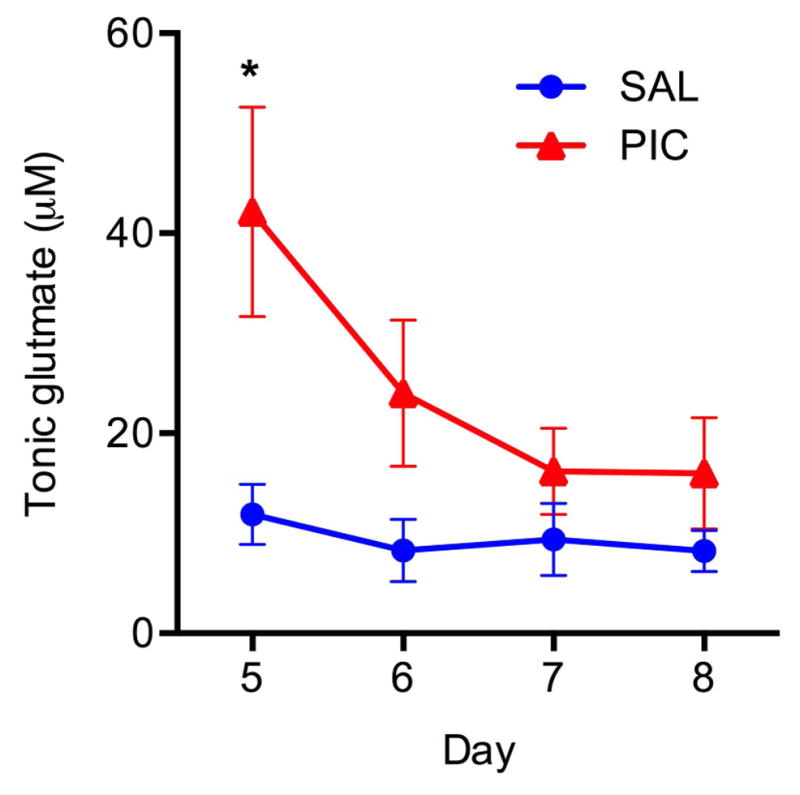
Figure 2. Changes in tonic glutamate levels induced by PIC challenge.

Mice implanted with MEA pedestals were challenged with PIC on Day 4 post-surgery (PIC), and tonic glutamate levels in the CA1 region was measured on Days 5, 6, 7 and 8. Saline-injected mice (SAL) served as controls. Symbols represent means ± SEM from 5 to 7 animals per group. Asterisks denote significant differences from saline controls (*p≤ .05).
